If you’ve spent any time watching forex charts, you’ve probably noticed that raw price action can look chaotic. Candles spike up, drop down, and whipsaw in ways that make it difficult to determine where the market is actually heading. That’s exactly the problem the moving average indicator for MT4 solves. By smoothing out price data over a set number of periods, the MA strips away the noise and reveals the underlying trend direction. It’s one of the most widely used indicators across all financial markets – and for good reason.
In this review, we’ll break down how the moving average works on MetaTrader 4, cover the best settings for different trading styles, and give you a straightforward strategy you can start using today.
What is the Moving Average Indicator?
A moving average calculates the average closing price of a currency pair over a defined number of candles, then plots that value as a continuous line on your chart. As each new candle forms, the oldest value drops off and the newest one gets added – which is why it “moves.”
There are several variations. The Simple Moving Average (SMA) treats every candle equally. The Exponential Moving Average (EMA) weights recent candles more heavily, making it react faster to current price changes. MT4 also includes the Smoothed Moving Average (SMMA) and the Linear Weighted Moving Average (LWMA), though these see less use in practice.
The concept dates back to the early days of technical analysis. There’s no single inventor – moving averages were a natural evolution from traders wanting to filter out short-term fluctuations and focus on the bigger picture. Today, they form the backbone of dozens of other indicators, including MACD, Bollinger Bands, and Ichimoku Cloud.
How the Moving Average Works on MT4
When you apply a moving average to a chart in MetaTrader 4, you’ll see a smooth line flowing through the price candles. The line rises during uptrends and falls during downtrends. During sideways markets, it tends to flatten out and hover near the current price.
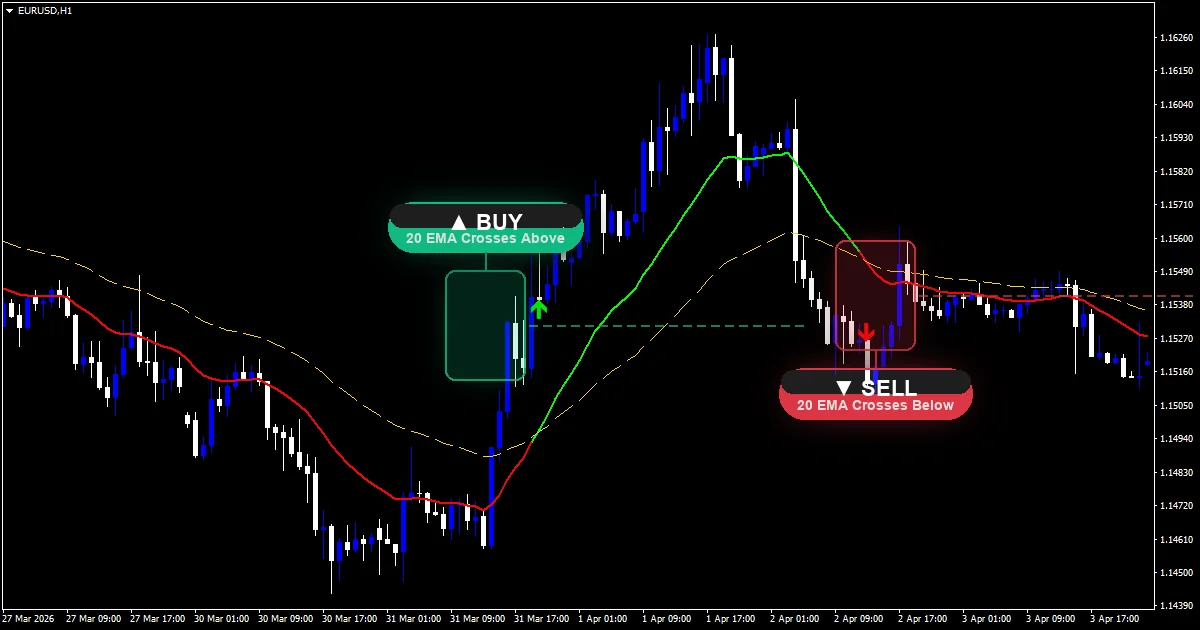
The most common way traders use it is directional bias. When price is trading above the MA line, the market is generally considered bullish. When price is below it, the bias shifts bearish. The angle of the line matters too – a steep upward slope signals strong momentum, while a flat MA suggests consolidation.
Signal generation typically involves one of two approaches. The first is a price crossover: buying when a candle closes above the MA and selling when it closes below. The second is an MA crossover, where a shorter-period MA crosses above or below a longer-period one. For example, a 20 EMA crossing above a 50 EMA is a classic bullish signal that many institutional traders monitor.
On a chart, you’d see the faster MA weaving above and below the slower one, with the crossover points marking potential entry zones. The space between the two lines widens during strong trends and narrows during consolidation.
Key Features
- Non-repainting: The MA line never changes once a candle closes, making it reliable for backtesting
- Works on every timeframe from M1 tick charts to monthly candles
- Built into MT4 by default – no custom indicator file needed
- Fully customizable period, method (SMA, EMA, SMMA, LWMA), and applied price
- Can display multiple MAs simultaneously with different colors for crossover setups
- Lightweight on system resources, even with several instances running across charts
Best Settings for Moving Average Indicator
The right settings depend entirely on how you trade. Here’s what works based on real-world testing:
| Parameter | Scalping (M1-M5) | Day Trading (M15-H1) | Swing Trading (H4-D1) |
|---|---|---|---|
| Fast MA Period | 8 EMA | 20 EMA | 50 EMA |
| Slow MA Period | 21 EMA | 50 EMA | 200 SMA |
| MA Method | Exponential | Exponential | Simple (slow) / Exponential (fast) |
| Applied Price | Close | Close | Close |
The 50 and 200 period moving averages carry special significance. When the 50 MA crosses above the 200 MA, it’s called a “Golden Cross” – widely watched by institutional traders as a long-term bullish signal. The opposite, a “Death Cross,” signals bearish momentum. These events regularly move markets on the daily timeframe.
Recommended starting point: If you’re new to MAs, start with a 20 EMA and 50 EMA on the H1 chart. This combination catches meaningful trend shifts without generating excessive signals.
Pros and Cons
| Pros | Cons |
|---|---|
| Extremely easy to understand and interpret, even for beginners | Lagging indicator by nature – signals come after the move has started |
| Effective across all currency pairs and timeframes | Generates frequent false signals in choppy, range-bound markets |
| Zero repainting – what you see is what you get | Requires a trending market to perform well |
| Pairs naturally with almost any other indicator for confirmation | Optimal period settings vary across pairs and market conditions |
How to Install Moving Average Indicator on MT4
Good news – the moving average is already built into MetaTrader 4. No download required.
Step 1: Open your MT4 terminal and select the chart you want to analyze.
Step 2: Click Insert in the top menu bar, then navigate to Indicators > Trend > Moving Average.
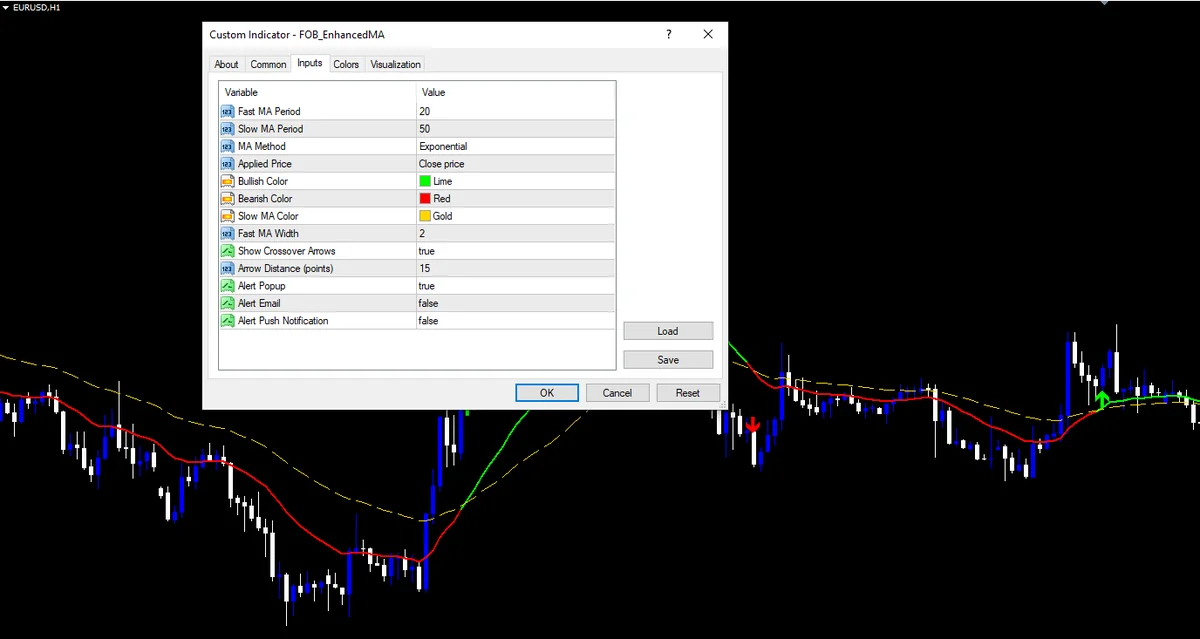
Step 3: In the popup window, set your desired period (e.g., 20), select the MA method (EMA for faster response, SMA for smoother), choose “Close” as the applied price, and pick a color for the line.
Step 4: Click OK. The moving average line now appears on your chart.
Step 5: To add a second MA for crossover setups, repeat the process with a different period (e.g., 50) and a contrasting color. You’ll now see both lines on the same chart, ready for crossover signal detection.
Tip: To save this configuration for future use, right-click the chart > Template > Save Template and name it something like “MA Crossover Setup.”
Need help with the basics? Check our full guide on how to install MetaTrader 4.
Trading Strategy Using Moving Average Indicator
Here’s a straightforward dual-MA crossover strategy that works well on the H1 and H4 timeframes:
Setup: Apply a 20 EMA (blue) and a 50 EMA (red) to your chart.
Buy Signal:
1. The 20 EMA crosses above the 50 EMA
2. Price pulls back and touches or comes near the 20 EMA without breaking below the 50 EMA
3. Enter long when a bullish candle closes above the 20 EMA after the pullback
Sell Signal:
1. The 20 EMA crosses below the 50 EMA
2. Price rallies back up toward the 20 EMA without breaking above the 50 EMA
3. Enter short when a bearish candle closes below the 20 EMA after the pullback
Stop Loss: Place the stop 5-10 pips beyond the 50 EMA line at the time of entry.
Take Profit: Target a 1:2 risk-reward ratio minimum. Alternatively, trail your stop along the 20 EMA line and exit when price closes beyond it against your position.
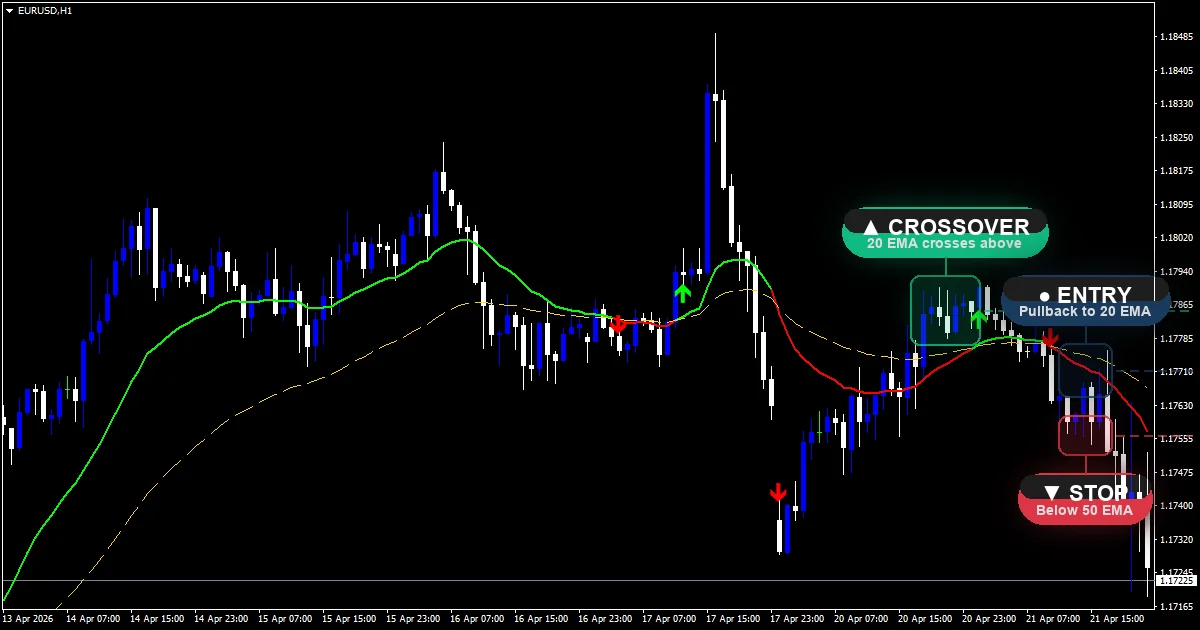
This pullback approach filters out a lot of the false signals that plague simple crossover strategies. You’re essentially waiting for the crossover to establish direction, then entering on a retracement rather than chasing the initial move.
Moving Average vs Bollinger Bands
Both indicators use moving averages at their core, but they serve different purposes:
| Feature | Moving Average | Bollinger Bands |
|---|---|---|
| Primary Use | Trend direction and dynamic support/resistance | Volatility measurement and mean reversion |
| Signal Type | Crossovers and price position relative to line | Squeeze breakouts and band touches |
| Best Market | Trending markets | Both trending and ranging |
| Complexity | Simple – single line per instance | Moderate – three lines (middle band + upper/lower) |
| Repainting | No | No |
Verdict: Use moving averages when your primary goal is identifying and riding trends. Switch to Bollinger Bands when you need to gauge volatility or trade reversals from overextended levels. Many traders use both together – the MA for directional bias and Bollinger Bands for entry timing.
Frequently Asked Questions
Is the Moving Average indicator free?
Yes. The moving average is built into every copy of MetaTrader 4. There’s no need to download or purchase anything – just apply it from the Indicators menu. If you want enhanced versions with additional features like multi-timeframe display or crossover alerts, we offer those as free downloads here on ForexOBroker.
Does the Moving Average indicator repaint?
No. Once a candle closes, the MA value for that candle is locked in permanently. This makes it one of the most reliable indicators for backtesting historical strategies. The line may appear to move on the current (unclosed) candle, but that’s normal – it finalizes when the candle completes.
What timeframe works best with Moving Average?
The H1 and H4 timeframes strike the best balance between signal quality and frequency for most traders. Shorter timeframes like M5 generate more signals but more noise, while daily charts produce highly reliable signals but require patience. Match the timeframe to your trading style.
Can I use Moving Average on MT5?
Absolutely. The moving average is built into MT5 as well, with the same customization options. The settings and behavior are identical across both platforms.
What pairs does Moving Average work best on?
Moving averages perform best on major pairs with strong trending tendencies: EUR/USD, GBP/USD, USD/JPY, and AUD/USD. They also work well on gold (XAU/USD) during directional moves. Avoid using MAs as your sole indicator on exotic pairs, which tend to be choppier and more prone to false signals.
Download Enhanced Moving Average Indicator for MT4 – Free
While the standard MA is built into MT4, our enhanced version includes features that the default lacks:
- Multi-timeframe MA display – see the H4 and D1 moving averages on your H1 chart
- Crossover alerts – popup, email, and push notifications when MAs cross
- Trend color coding – the MA line changes color based on slope direction
Platform: MT4 (Build 1000+)
File type: .ex4
File size: 12 KB
Version: 2.4
Last updated: March 2026
Download the Moving Average (MA) Indicator – Free Instant Access
No payment. No catch. Enter your email below and the Moving Average (MA) Indicator file lands in your inbox within 60 seconds. Here’s everything you get:
- The non-repainting Moving Average (MA) Indicator file (.ex4) – install in 30 seconds
- Step-by-step installation guide with chart screenshots
- Best-performing settings for scalping, day trading, and swing trading
- The exact entry and exit rules Dom uses in live trading
- Weekly trading insights from a developer with 16+ years of market experience
100% free forever. Your email is safe – we never sell, share, or spam. Unsubscribe with one click anytime.
By downloading, you agree to receive trading tips and indicator updates from ForexOBroker. Unsubscribe anytime.
Overall Rating: 4.5/5
| Category | Rating |
|---|---|
| Accuracy | 4.2/5 |
| Ease of Use | 5.0/5 |
| Features | 4.3/5 |
| Value | 4.9/5 |
Related Indicators
- EMA Indicator MT4 – A deeper look at the exponential moving average with advanced crossover strategies
- MACD Indicator MT4 – Built on moving averages, the MACD adds momentum analysis to trend identification
- Supertrend Indicator MT4 – A trend-following alternative that combines ATR with moving average logic
- See all Trend Indicators – Browse our complete trend indicator collection
- best trend indicators for MT4
- How to Install Custom Indicators on MT4
Trading forex involves significant risk of loss and is not suitable for all investors. Past performance is not indicative of future results. The indicators provided on ForexOBroker are for educational purposes only. Always use proper risk management and never trade with money you cannot afford to lose.
