Volume Adjusted Rsi Mt4 Indicator Review
The Relative Strength Index (RSI) is a popular technical indicator used by traders to identify overbought and oversold market conditions. It operates by comparing the magnitude of recent gains to recent losses in an effort to determine whether an asset has been overbought or oversold.
However, the traditional RSI does not take into account volume, which can be a significant factor in determining price movements. This is where the Volume Adjusted RSI MT4 Indicator comes into play.
Download Free Volume Adjusted Rsi Mt4 Indicator
Incorporating volume into the RSI indicator allows for a more accurate analysis of market conditions as it provides insight into the strength of buying or selling pressure behind price movements. The Volume Adjusted RSI MT4 Indicator uses both price data and volume data to calculate its readings, resulting in a more comprehensive representation of market sentiment.
Traders who use this indicator are able to make more informed trading decisions as they have access to information that would otherwise be unavailable with traditional indicators alone. In this article, we will explore how this powerful tool works and how you can benefit from using it in your trading strategy.
Understanding the Relative Strength Index (RSI) Indicator
The present section aims to provide a comprehensive understanding of the Relative Strength Index, a technical analysis tool used by traders to identify overbought or oversold conditions in the market.
The RSI is a momentum oscillator that measures the strength and speed of price movements by comparing upward movements to downward movements over a specific period. By analyzing these price movements, traders can gain insight into potential trend reversals or continuation.
Interpreting RSI signals involves understanding how it works relative to other indicators. For example, while both the Moving Average Convergence Divergence (MACD) and RSI are momentum indicators, they differ in their approach.
The MACD measures the difference between two moving averages and is useful for identifying trends and momentum changes. In contrast, the RSI compares bullish and bearish price movement within a specified timeframe and can indicate when an asset may be overbought or oversold.
This information helps traders make more informed decisions about when to enter or exit positions based on market conditions.
Incorporating Volume into the RSI Indicator
This section explores a new approach to incorporating market activity data into an established technical analysis tool, providing valuable insights for traders seeking to make more informed investment decisions. The Relative Strength Index (RSI) is a popular momentum oscillator used by investors to identify overbought or oversold conditions in the market. However, this indicator does not take into account the volume of trades, which can provide additional information about market behavior.
To address this limitation, traders can use volume analysis to calculate a volume-weighted RSI. This modified version of the RSI takes into consideration both price movements and trading volumes, providing a more accurate representation of market activity. By weighting the RSI based on trading volumes, traders can gain deeper insights into the strength of buying or selling pressure in the market.
To calculate a volume-weighted RSI, traders need to follow these steps:
- Calculate average gains and losses: As with traditional RSI calculation, start by calculating average gains and losses over a selected period.
- Calculate relative strength (RS): Divide average gain by average loss.
- Incorporate volume: Multiply RS by current period’s trading volume.
- Calculate volume-weighted RSI: Use the result from step 3 in place of RS for traditional RSI formula.
By using this modified indicator that incorporates both price movements and trading volumes, traders can make more informed decisions about when to enter or exit positions in the market based on stronger signals that are backed up by additional data points.
How to Use the Volume Adjusted RSI MT4 Indicator
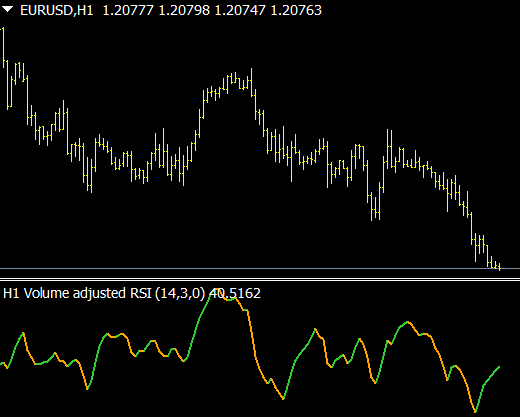
Traders seeking to enhance their technical analysis toolbox with a momentum oscillator that incorporates both price movements and trading volumes can benefit from understanding how to utilize the volume adjusted RSI MT4 indicator for forex trading. This modified version of the traditional RSI formula provides more accurate insights into market activity by incorporating trade volumes in its calculations. The volume adjusted RSI MT4 indicator is an effective tool for identifying potential trend reversals, divergences, and overbought/oversold conditions.
To set up the volume adjusted RSI MT4 indicator for optimal performance, traders can follow these steps:
- Open MT4 and select “Insert” from the top menu.
- Choose “Indicators” then “Oscillators” and finally select “Relative Strength Index”.
- In the input parameters section of the indicator settings, adjust the following values: period (default is 14), moving average type (default is simple), and applied price (default is close).
- Check the box next to “Volume Weighted” to activate the volume adjusted feature.
- Adjust any other parameters such as color or line thickness according to personal preferences.
By properly configuring this powerful tool, traders can gain valuable insights into market trends while also incorporating crucial data on trading volumes for greater accuracy in their analysis.
Tips for Maximizing the Benefits of the Volume Adjusted RSI MT4 Indicator
To fully capitalize on the potential benefits of this momentum oscillator that accounts for both price movements and trading volumes, traders may consider implementing some key tips for optimizing their use of the volume-adjusted RSI MT4 indicator.
Firstly, risk management strategies should be employed when using any technical analysis tool, including this indicator. Traders should avoid over-reliance on a single indicator and instead look to confirm signals with other indicators or chart patterns. Additionally, traders should set stop-loss orders to limit potential losses in case the market moves against them.
Secondly, it is important to avoid common trading mistakes when using the volume-adjusted RSI MT4 indicator. One such mistake is chasing trades based solely on oversold or overbought readings from the indicator without considering other factors such as trend direction or overall market sentiment. Another common mistake is failing to adjust settings for different markets or timeframes; traders should ensure that they are using appropriate inputs based on their specific trade setup.
By following these tips and avoiding common mistakes, traders can effectively utilize the volume-adjusted RSI MT4 indicator in their trading strategies and improve their chances of success.
Conclusion
The volume adjusted RSI MT4 indicator is a powerful tool for traders looking to incorporate volume data into their technical analysis. By taking into account both price movements and trading volume, this indicator provides a more comprehensive picture of market sentiment and can help identify potential buying or selling opportunities.
To use the volume adjusted RSI MT4 indicator effectively, it’s important to understand how the Relative Strength Index (RSI) works and why incorporating volume data is valuable. Traders should also consider using other indicators and tools in conjunction with the volume adjusted RSI to confirm signals and reduce false positives.
Overall, the volume adjusted RSI MT4 indicator can be an invaluable addition to any trader’s toolkit. By providing a more nuanced understanding of market dynamics, it can help traders make better-informed decisions and increase their chances of success in the markets.
As with any technical analysis tool, however, it’s important to use this indicator judiciously and in combination with other tools for best results.
