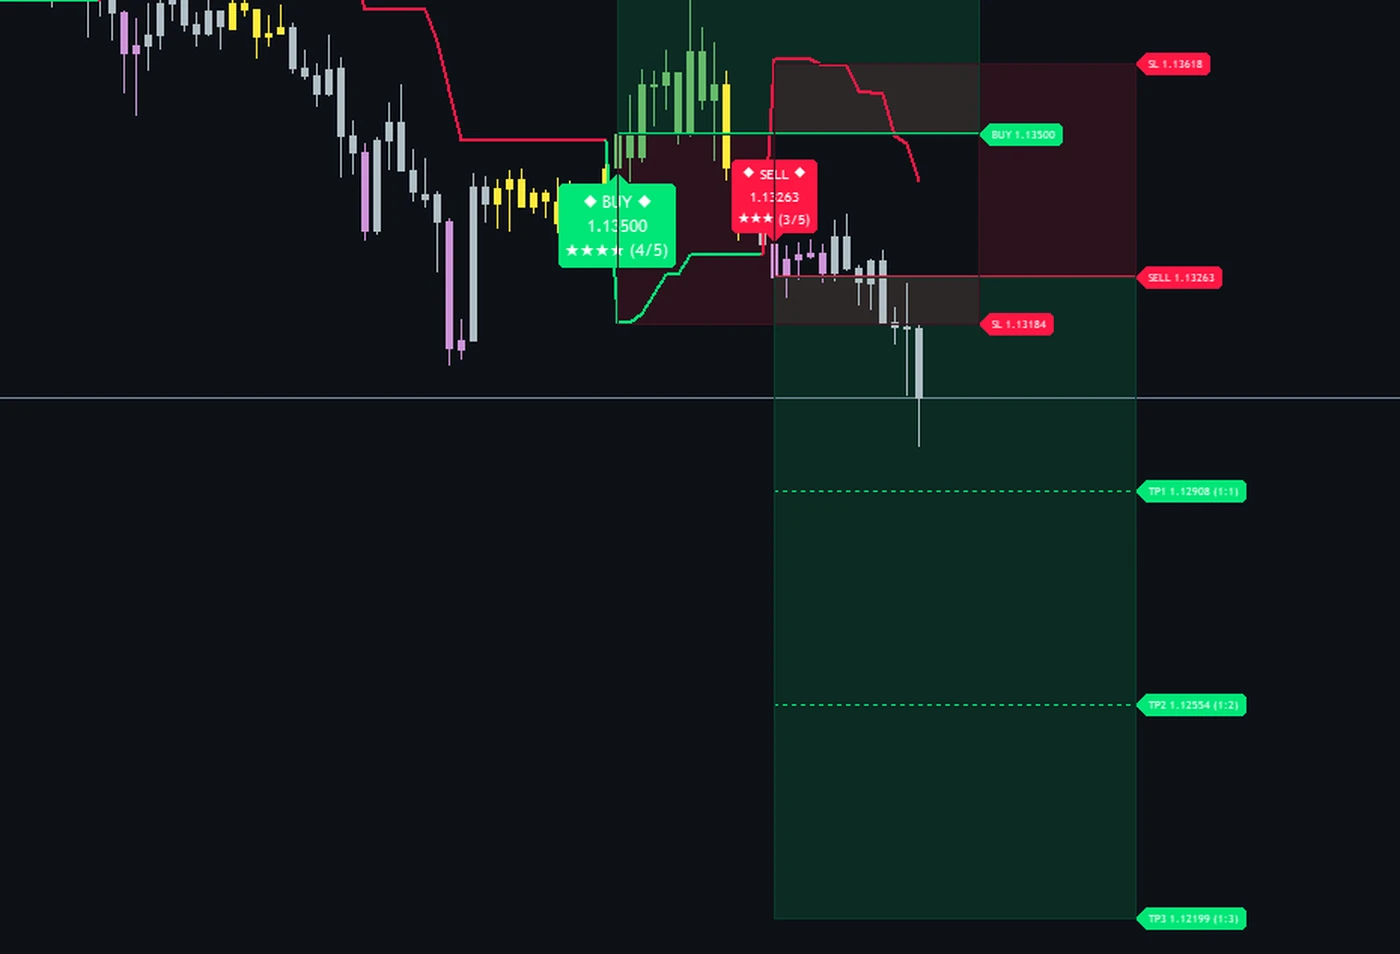
SuperTrend signals rated out of five, with the stop and three targets already drawn.
Hyper Trend PRO takes every SuperTrend flip on a closed bar and checks it five ways: MACD momentum, the EMA 150/250 trend, ADX, volume and the Hull slope. Each signal prints as a plate with its price and star rating, with the entry, the stop and three targets drawn from the same bar, and a dashboard that reads the market for you. One purchase includes both the .ex4 and the .ex5.
- Decided on closed bars. Once a signal prints it does not move or disappear.
- You choose how selective: on the 20 MetaTrader 5 charts we measured, 17 to 30 signals per 1,000 bars with every flip, 8 to 18 with Strong+.
- MetaTrader 4 and 5 builds and a PDF manual for each, one-time $47.
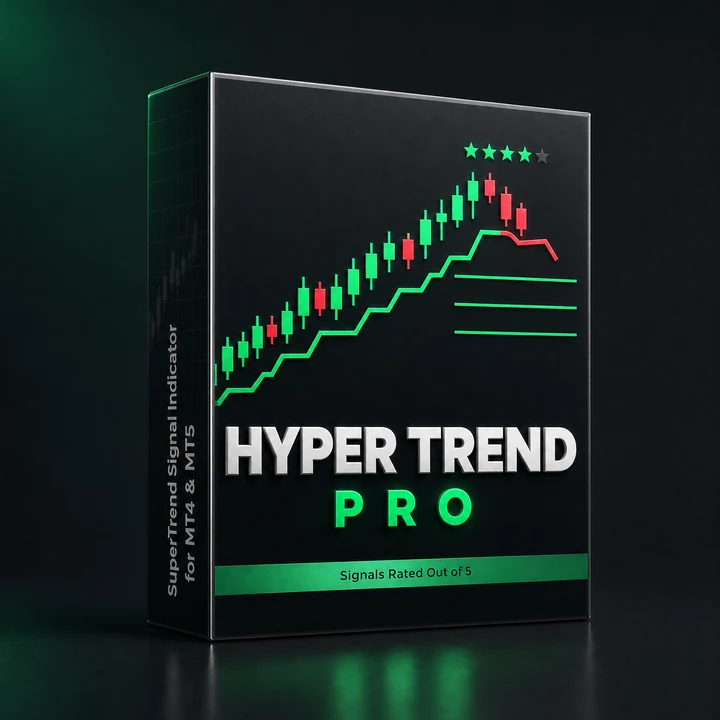
Schematic of the rule: five checks give the stars, the preset sets the minimum, and the plate prints on the closed bar with the entry, the stop one risk away and targets at 1, 2 and 3 times that risk (the defaults). The real charts are further down the page.
Measured on these markets
Runs on
 MetaTrader 4
 MetaTrader 5
A flip tells you the direction changed. It does not tell you how much agrees, or where you are wrong.
A SuperTrend is one of the clearest trend tools there is, and one of the most frustrating. It flips the same way in a strong trend and in a sideways grind, every flip looks equally important, and once you are in, the line says nothing about where to take profit or how far the market can go against you before the idea is wrong.
Hyper Trend PRO keeps the SuperTrend and adds the two things it is missing. Every flip on a closed bar is rated: one star for each of five independent checks that agree, so a five-star flip and a one-star flip no longer look the same. And every signal comes with its own plan: the entry, a stop one risk away and three targets at multiples of that risk, drawn at the moment it prints. The preset decides how many stars a flip needs before you see it.
Read the charts, not the promise. Every chart on this page is a real MetaTrader capture of the shipped build at its default settings, and every number in the frequency table was counted on those charts. Nothing is drawn in by hand. Click any chart to open it full size.
Signals per 1,000 bars for each preset, on 20 MetaTrader 5 charts
Signals on the last 1,000 closed bars of each chart, with the default inputs and each of the four presets. The preset is the minimum star rating a flip needs. It tells you how busy a chart will be, not how many signals win.
| Market | Chart | All Signals | Trend Scalper | Quality+ | Strong+ |
|---|---|---|---|---|---|
| EURUSD | M1517 Sep to 1 Oct 2026 | ||||
| EURUSD | H14 Aug to 1 Oct 2026 | ||||
| GBPUSD | M302 Sep to 1 Oct 2026 | ||||
| USDJPY | H14 Aug to 1 Oct 2026 | ||||
| AUDUSD | H14 Aug to 1 Oct 2026 | ||||
| USDCAD | M302 Sep to 1 Oct 2026 | ||||
| EURGBP | H410 Feb to 1 Oct 2026 | ||||
| Gold (XAUUSD) | M1514 Sep to 29 Sep 2026 | ||||
| Gold (XAUUSD) | H130 Jul to 29 Sep 2026 | ||||
| Gold (XAUUSD) | H46 Feb to 29 Sep 2026 | ||||
| Silver (XAGUSD) | H131 Jul to 1 Oct 2026 | ||||
| Bitcoin (BTCUSD) | H120 Aug to 1 Oct 2026 | ||||
| Nasdaq 100 (NAS100) | M301 Sep to 1 Oct 2026 | ||||
| DAX 40 (GER40) | H131 Jul to 1 Oct 2026 | ||||
| WTI crude (USWTI) | H131 Jul to 1 Oct 2026 |
What this table admits: across all 20 MetaTrader 5 charts the four presets gave All Signals 17 to 30; Trend Scalper 17 to 30; Quality+ 15 to 29; Strong+ 8 to 18 signals per 1,000 bars. All Signals, the default, shows every flip; Strong+ kept between 37 and 65 percent of them on these charts. Fewer signals is not the same as better signals: a star rating says how much agreed at the flip, not whether the move that followed was worth taking, and the charts below show both kinds.
30 real MetaTrader charts at default settings
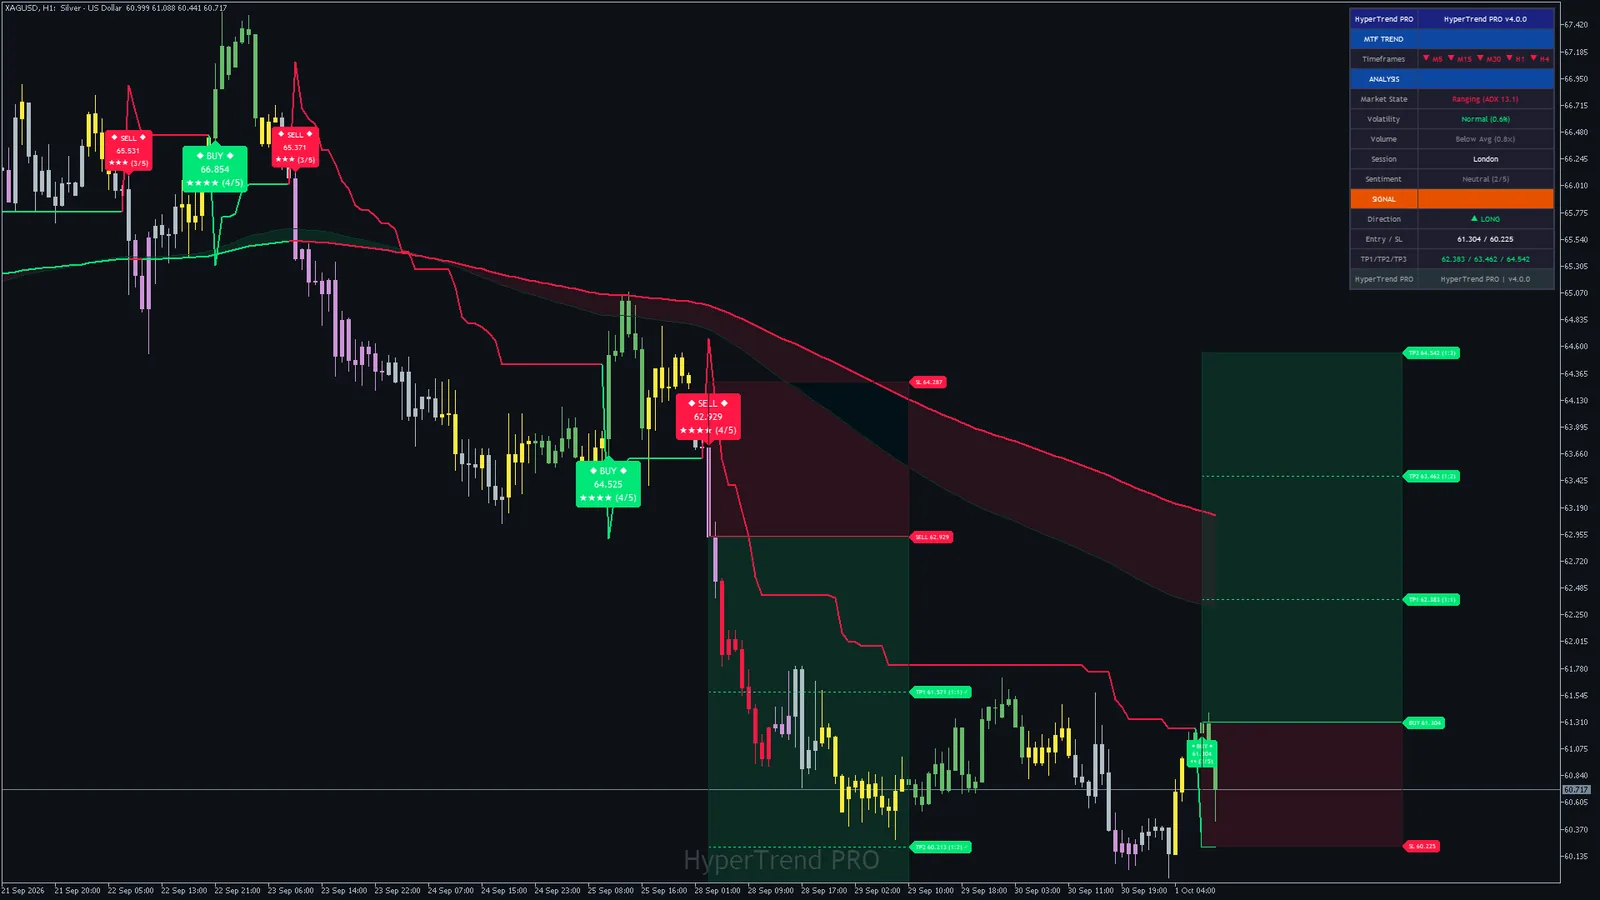
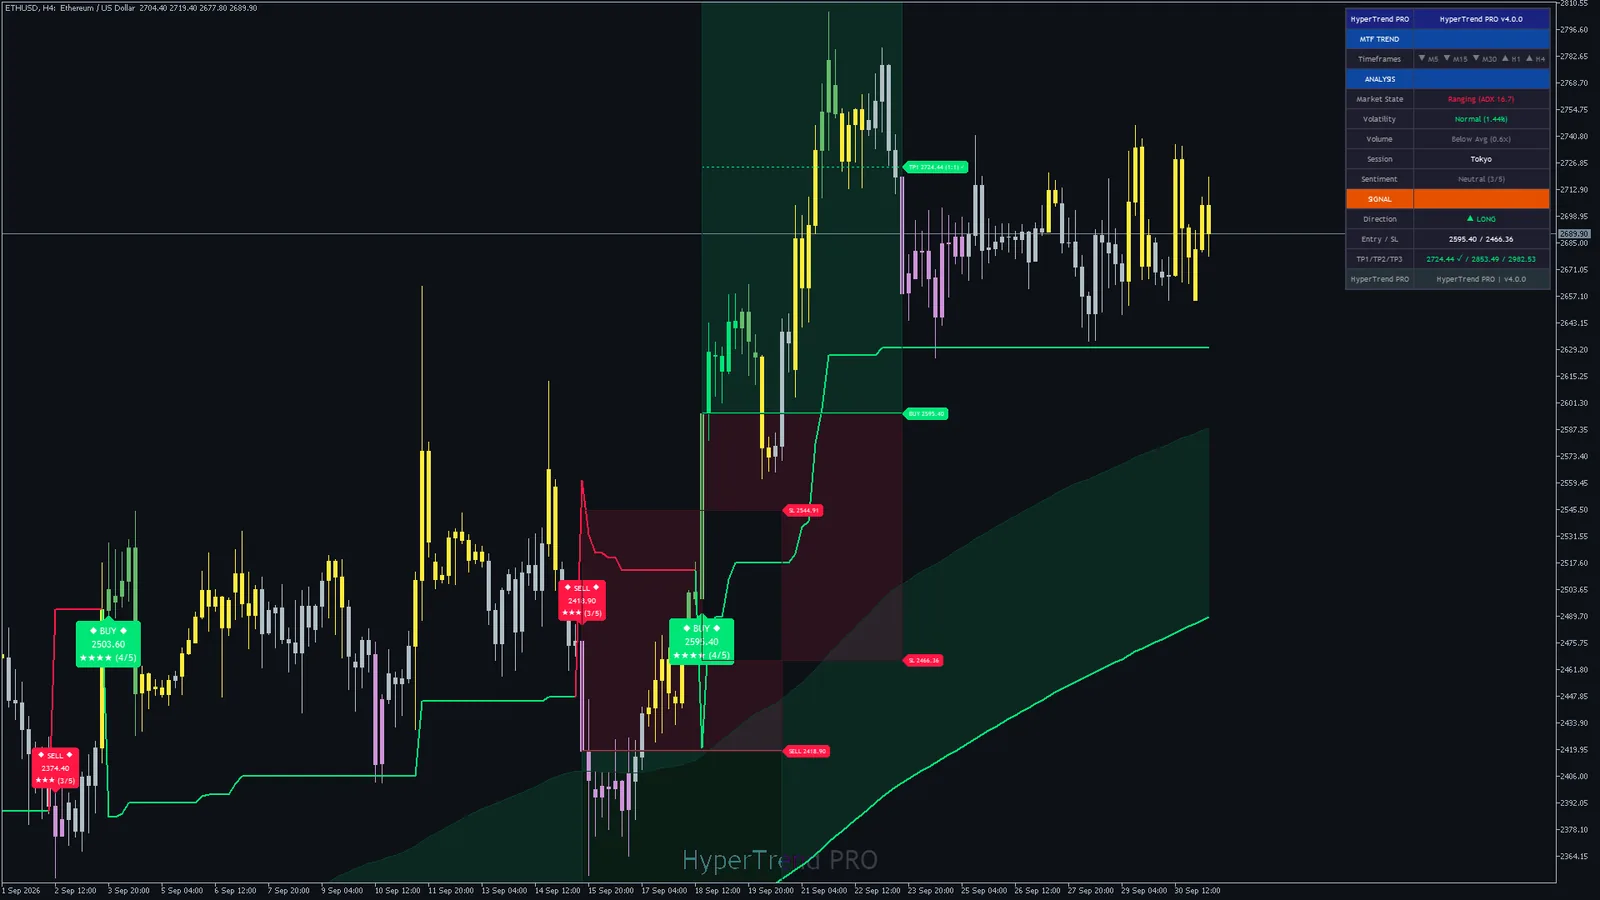
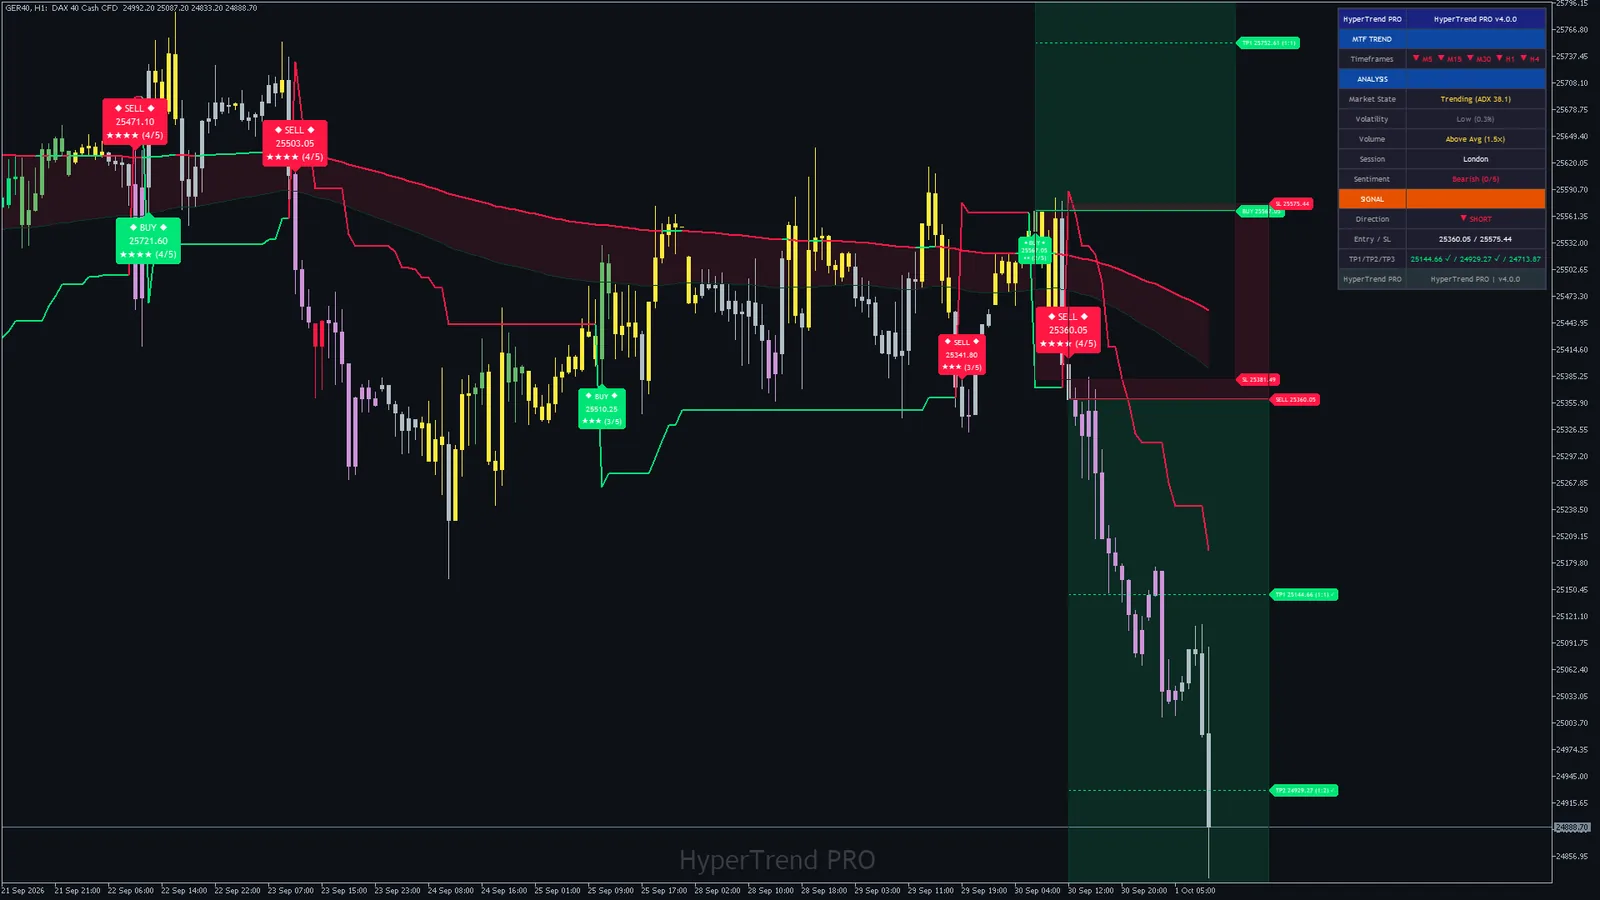
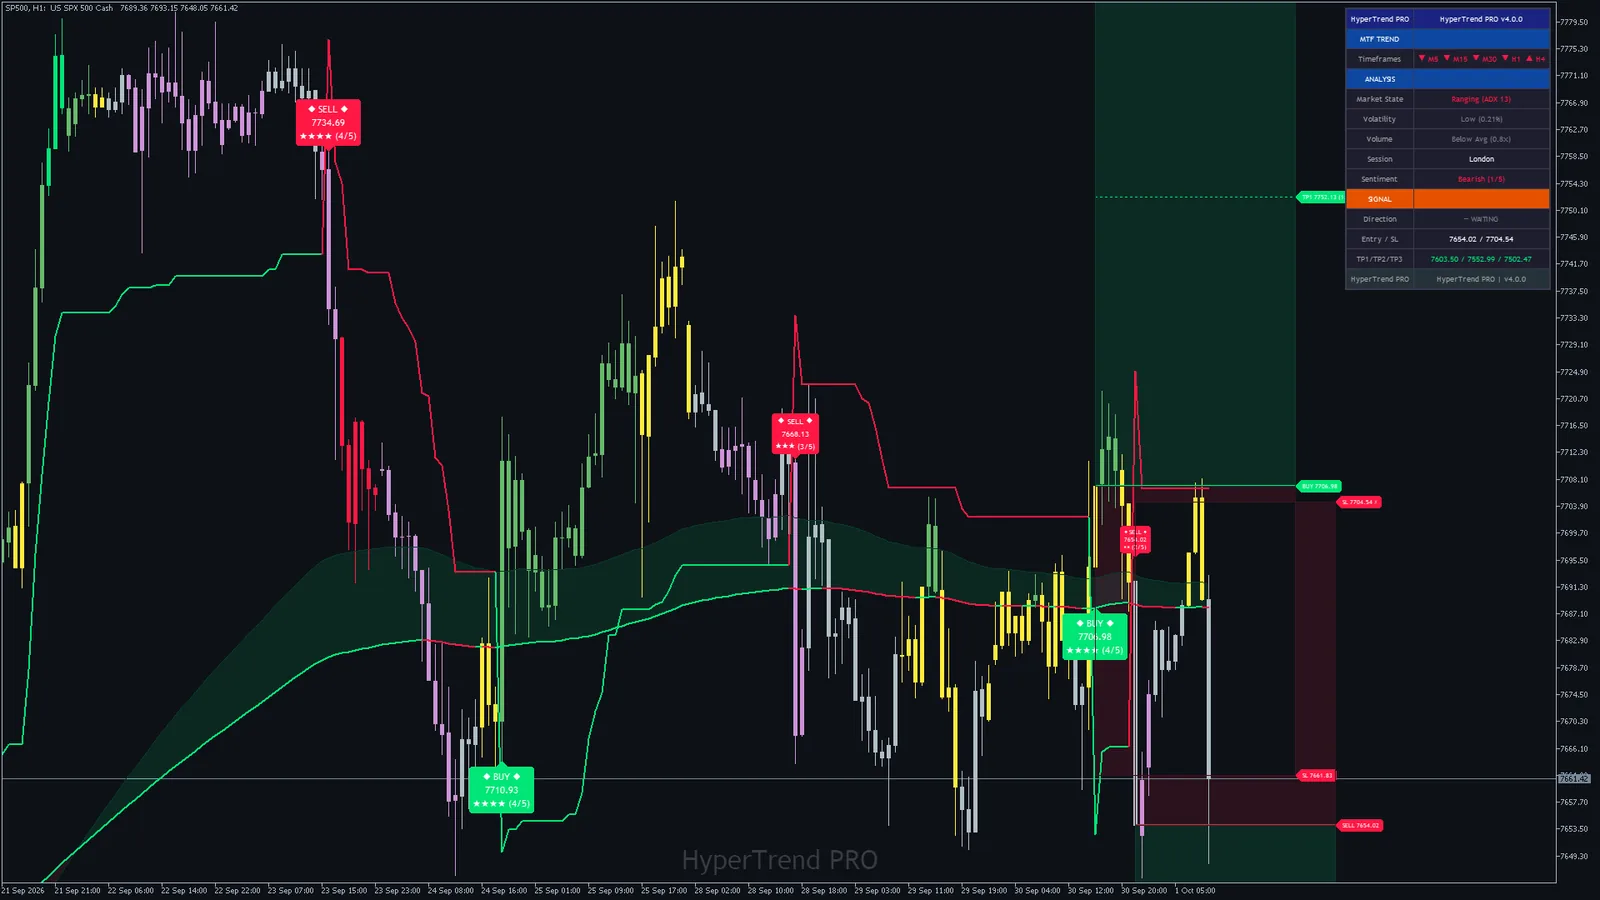
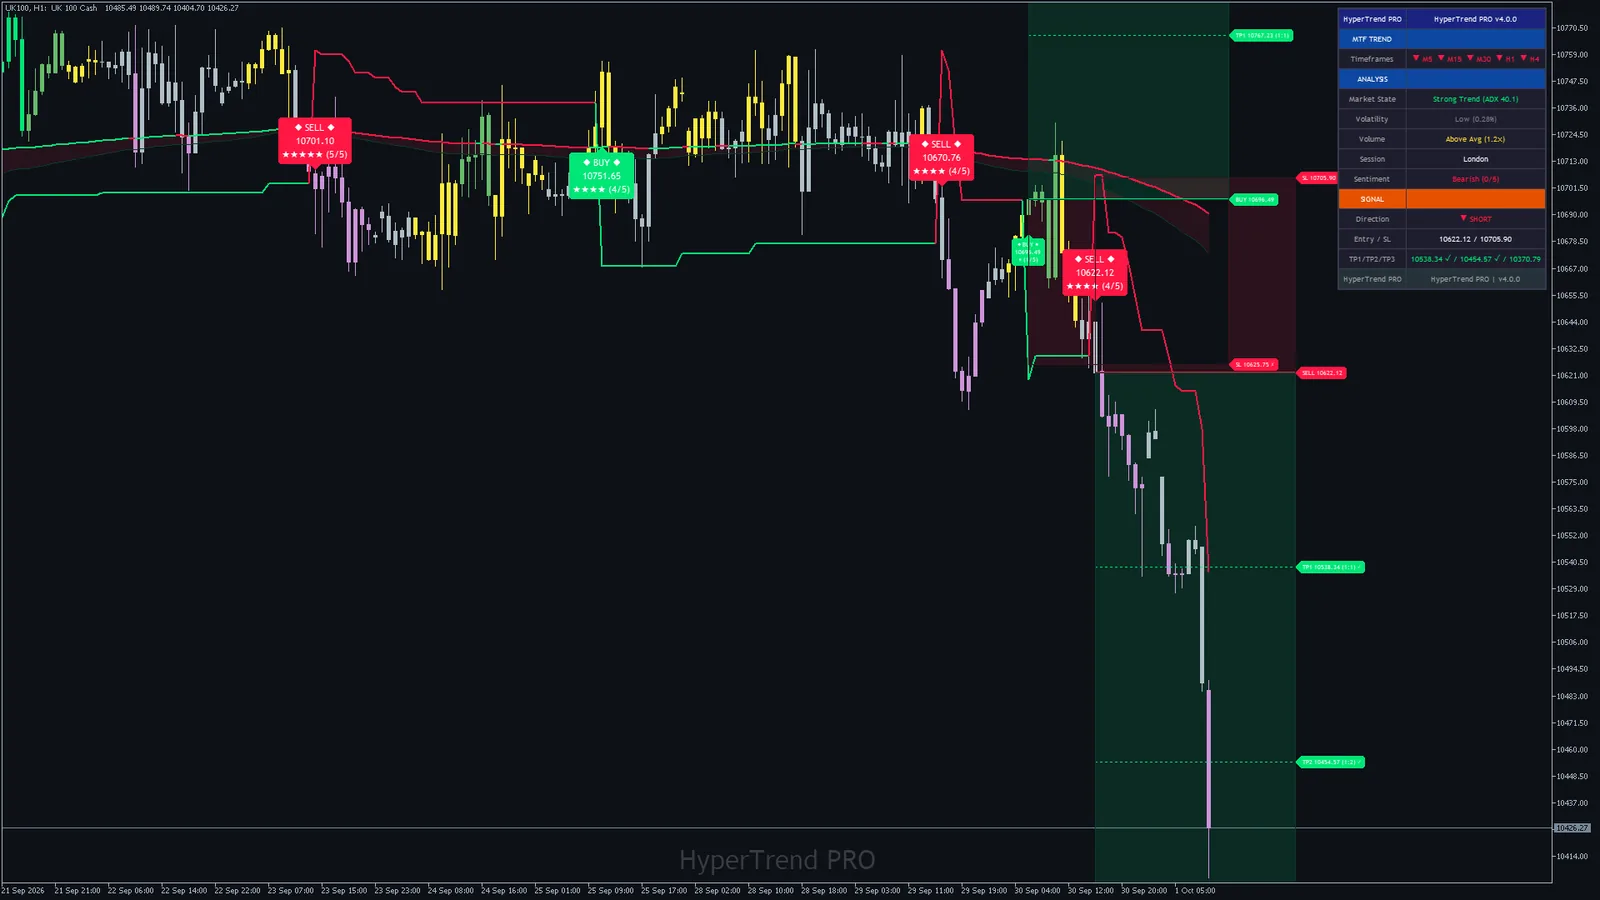
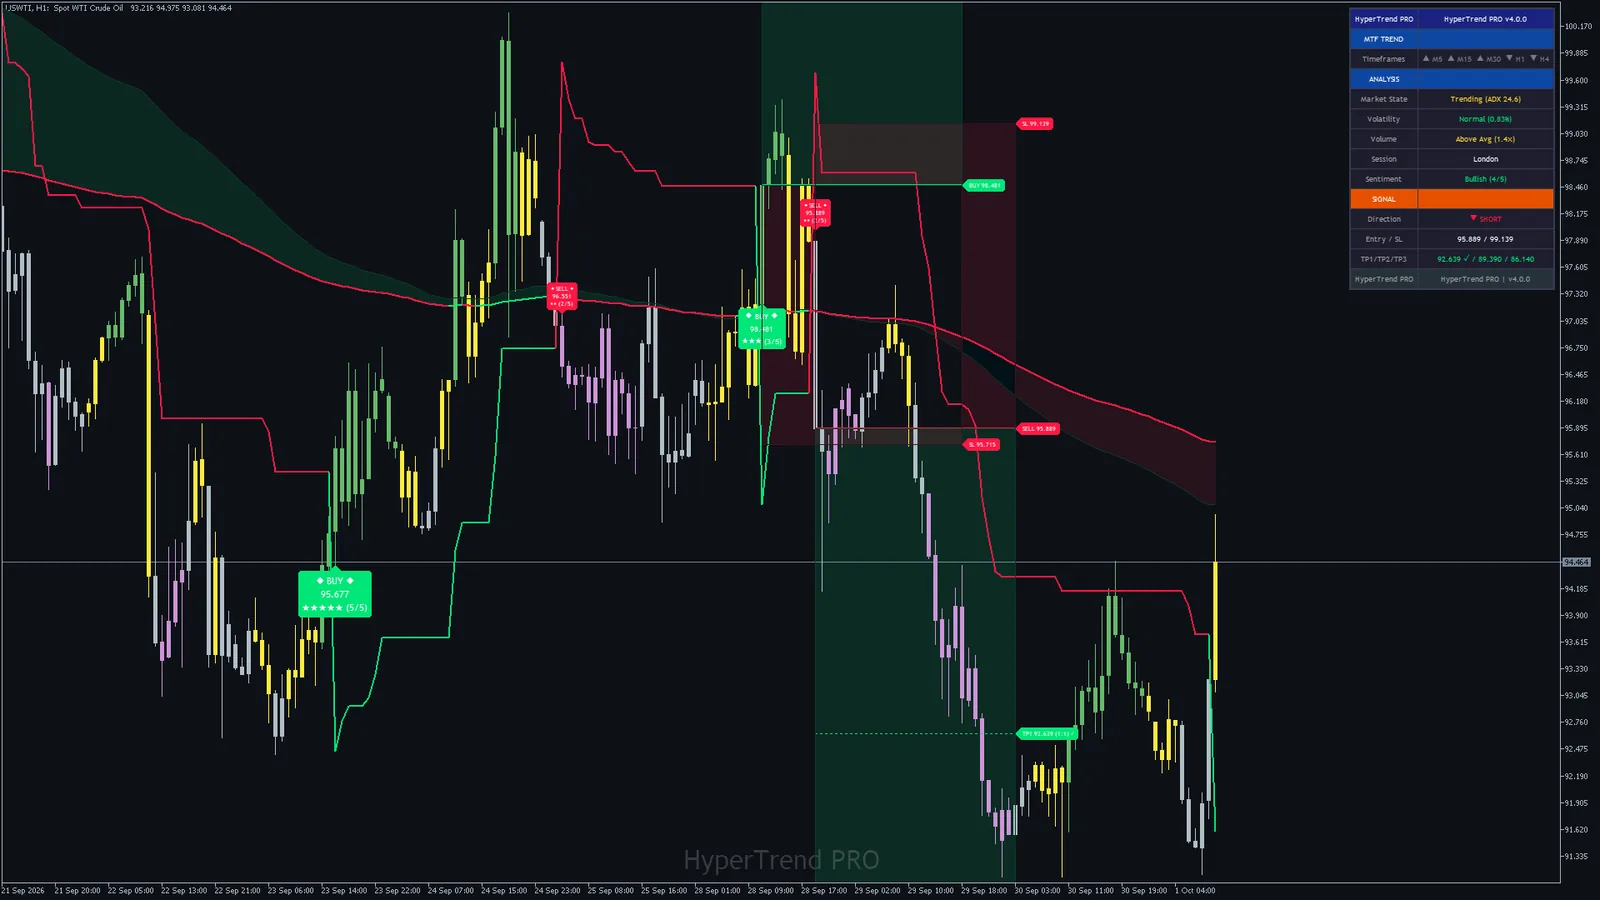
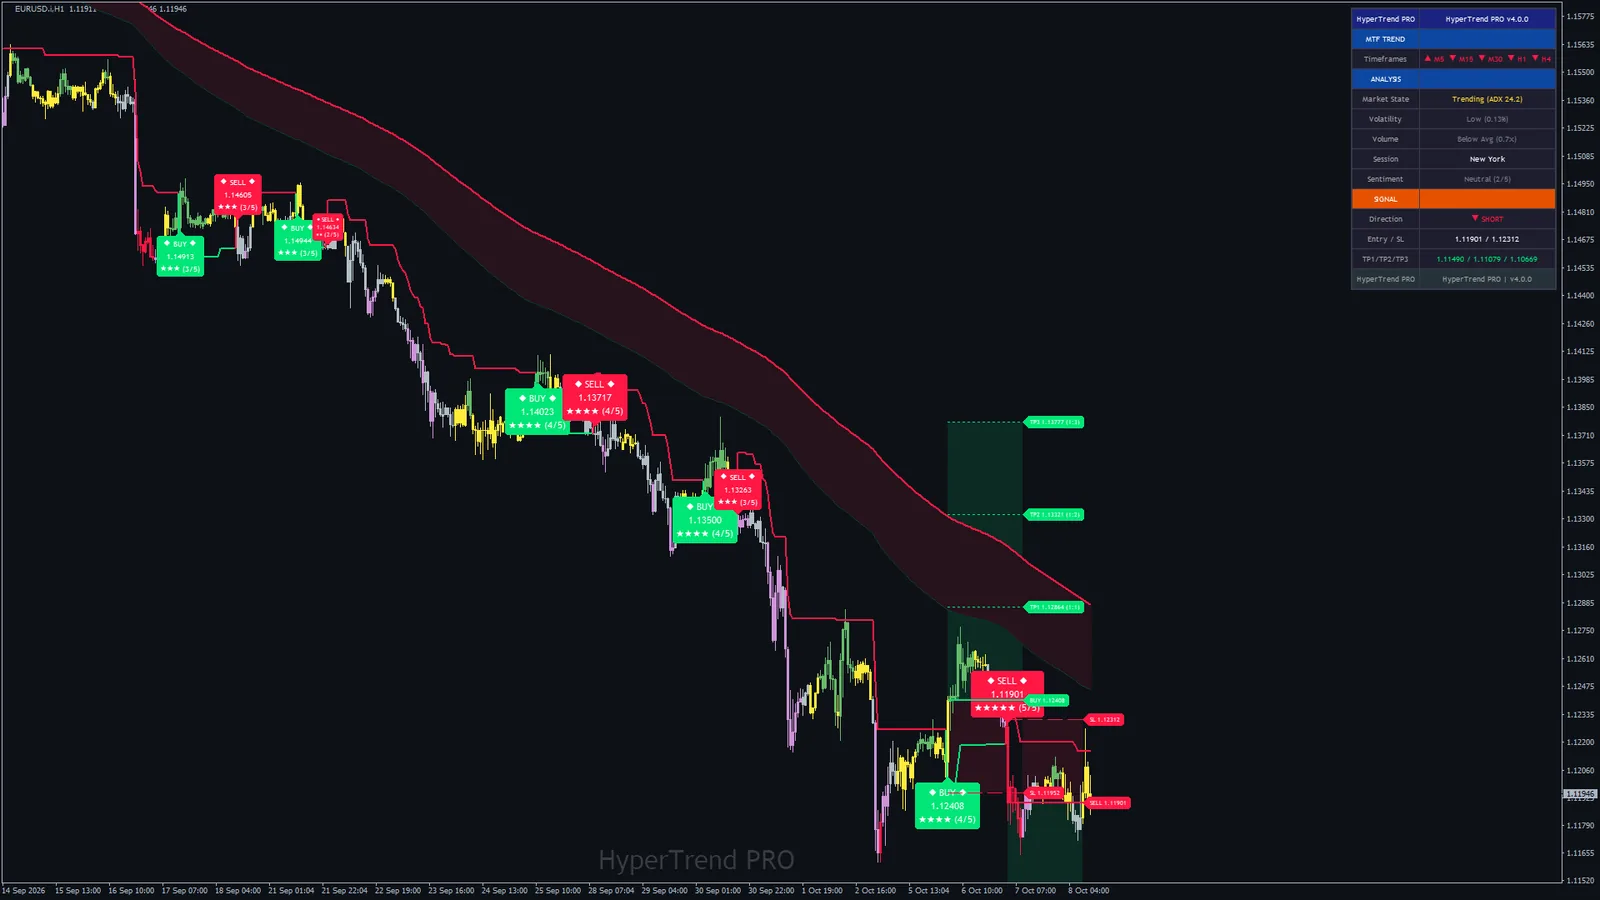
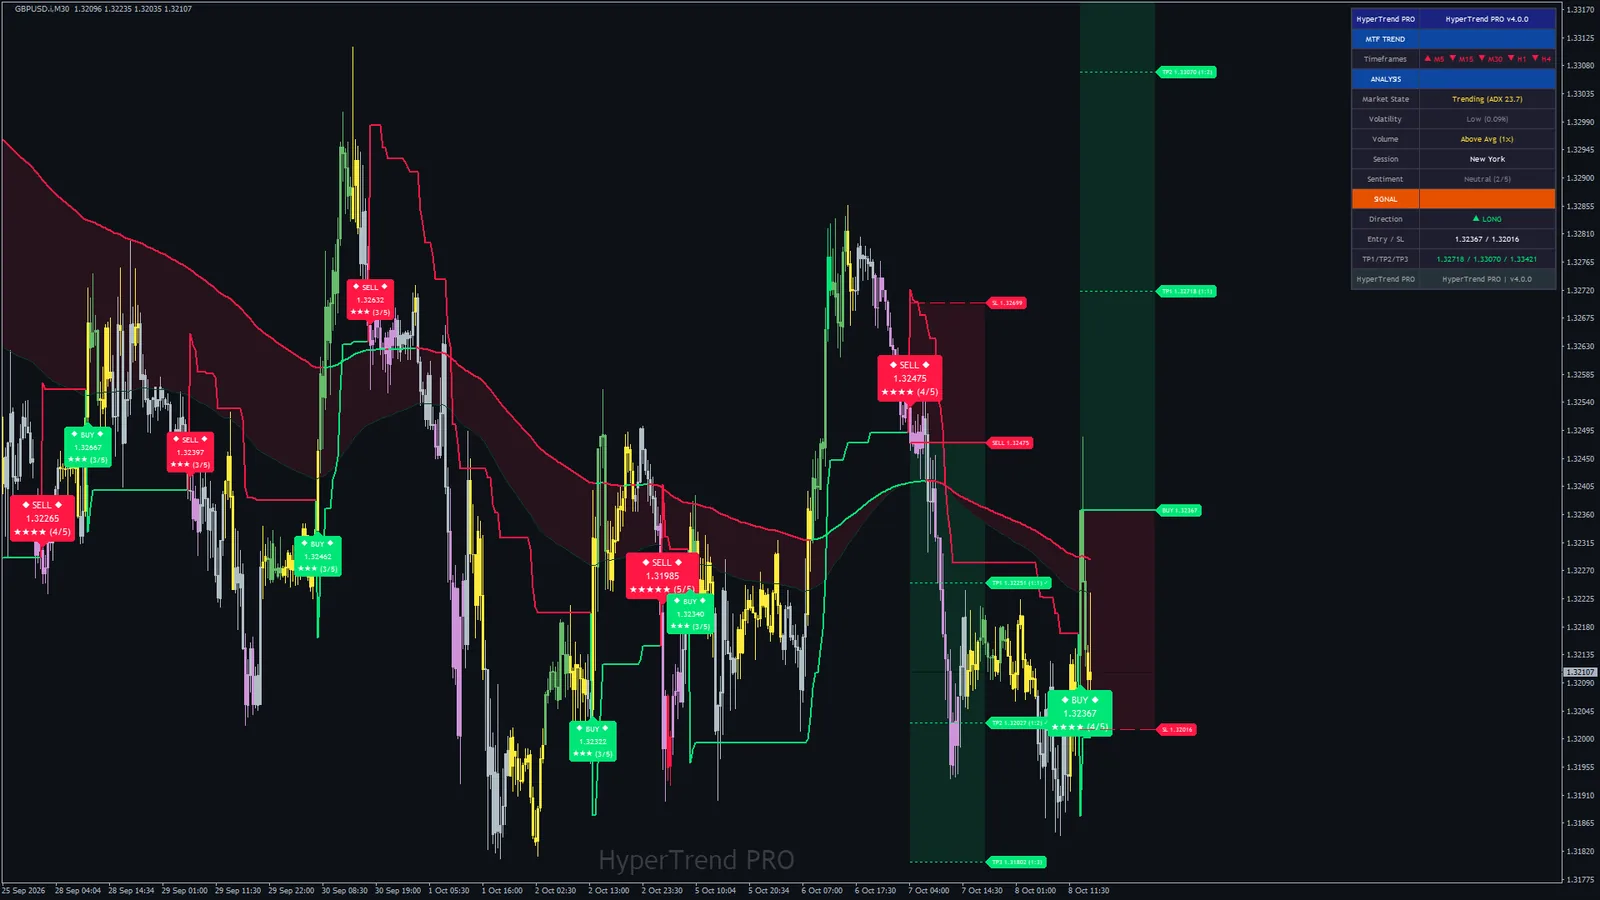
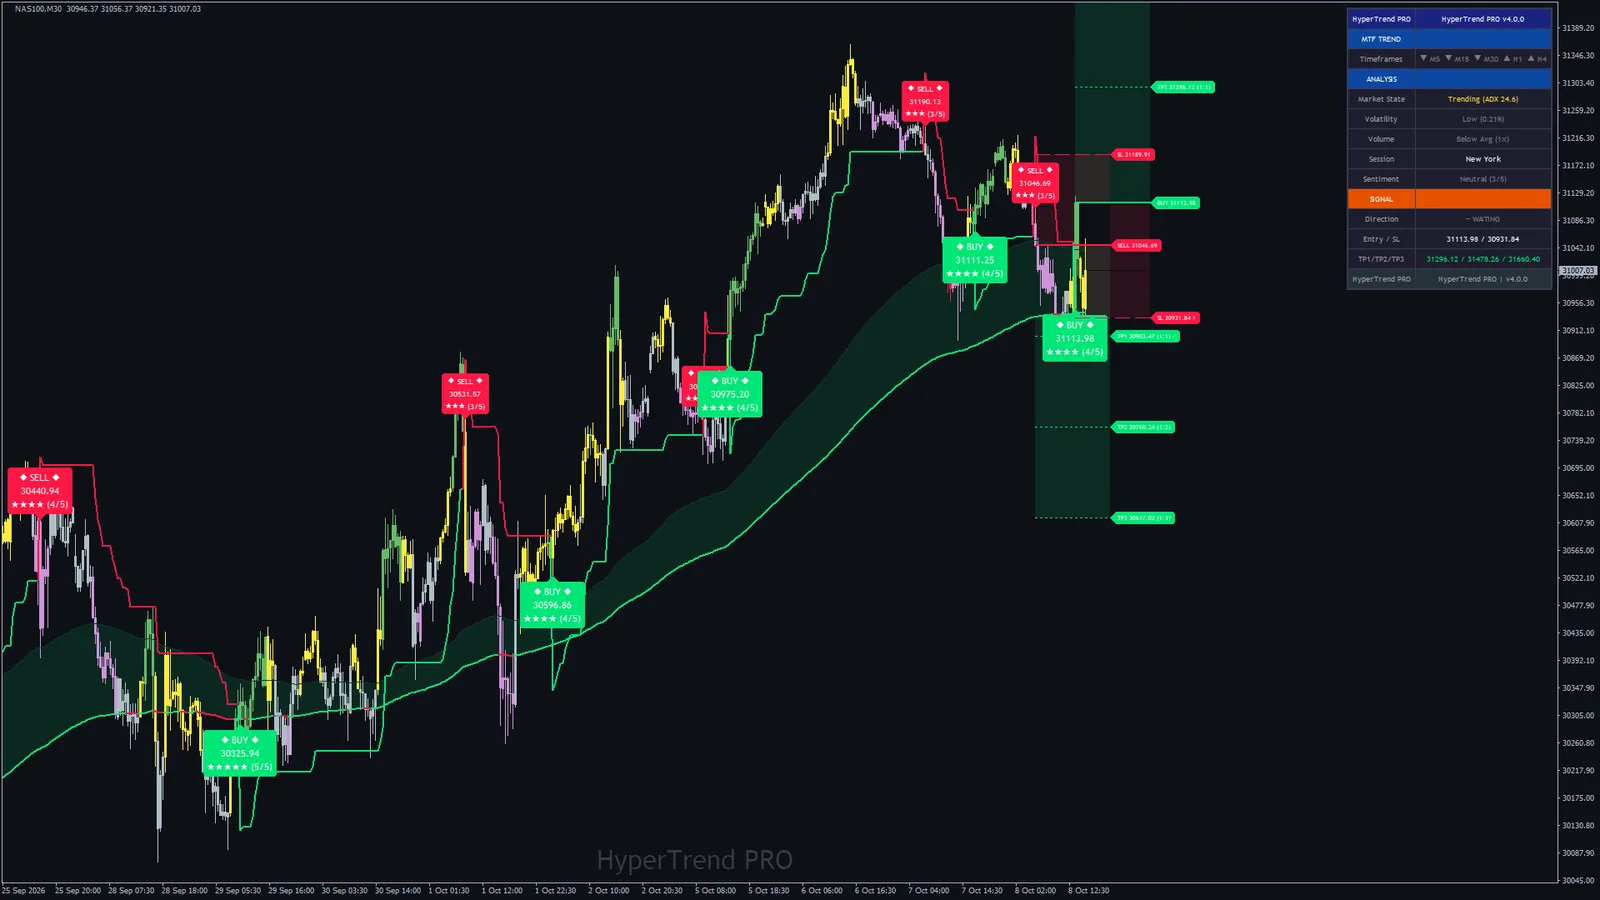
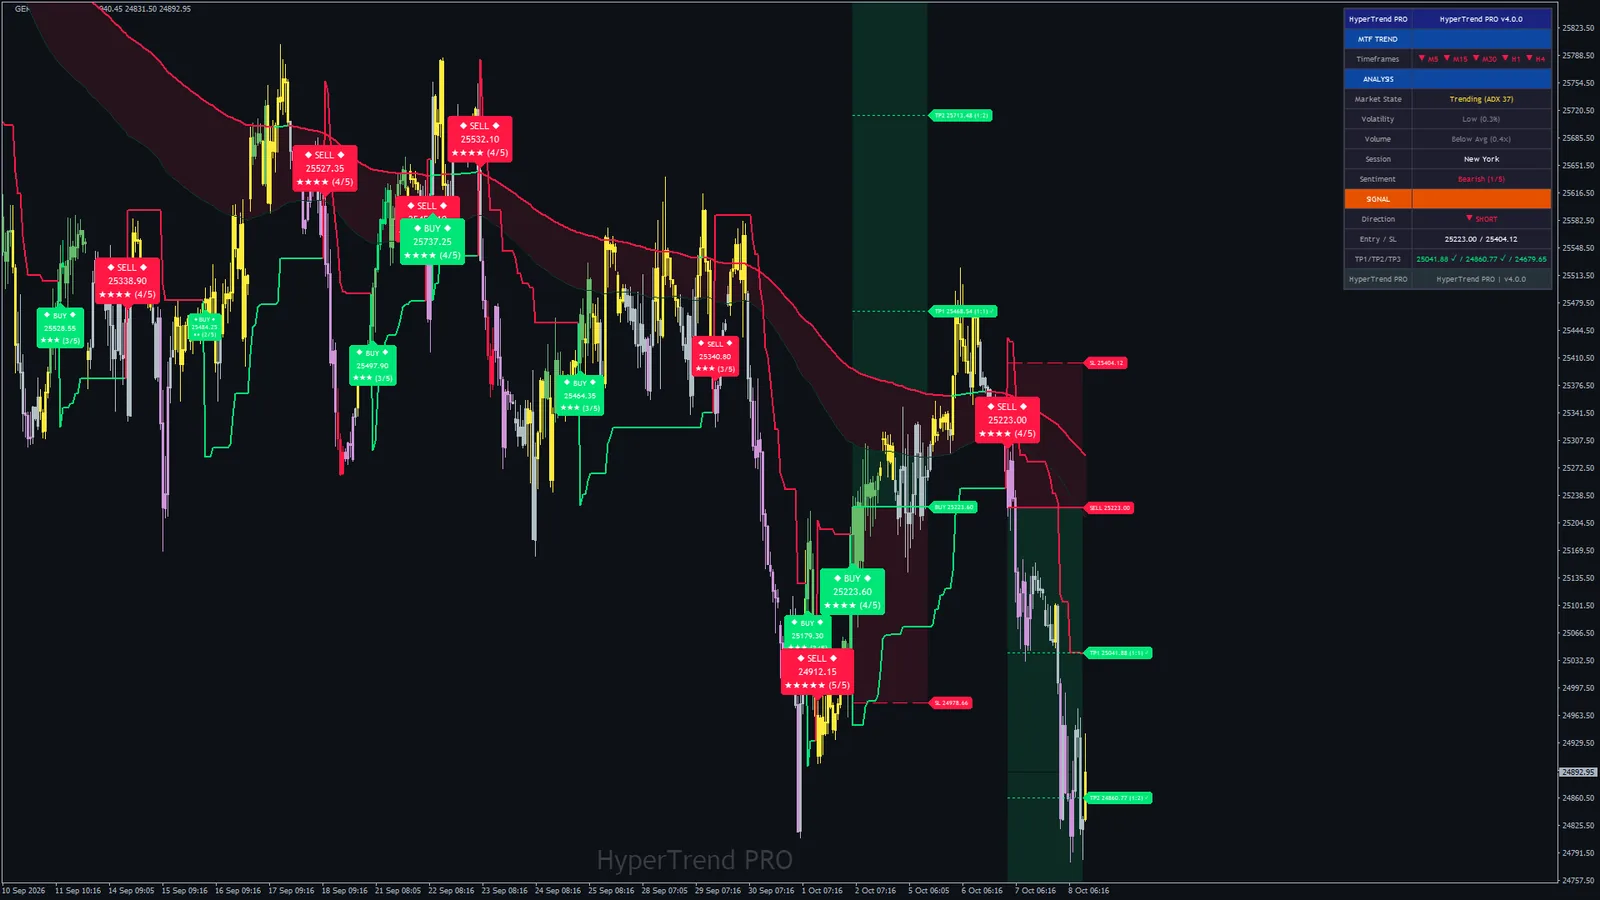
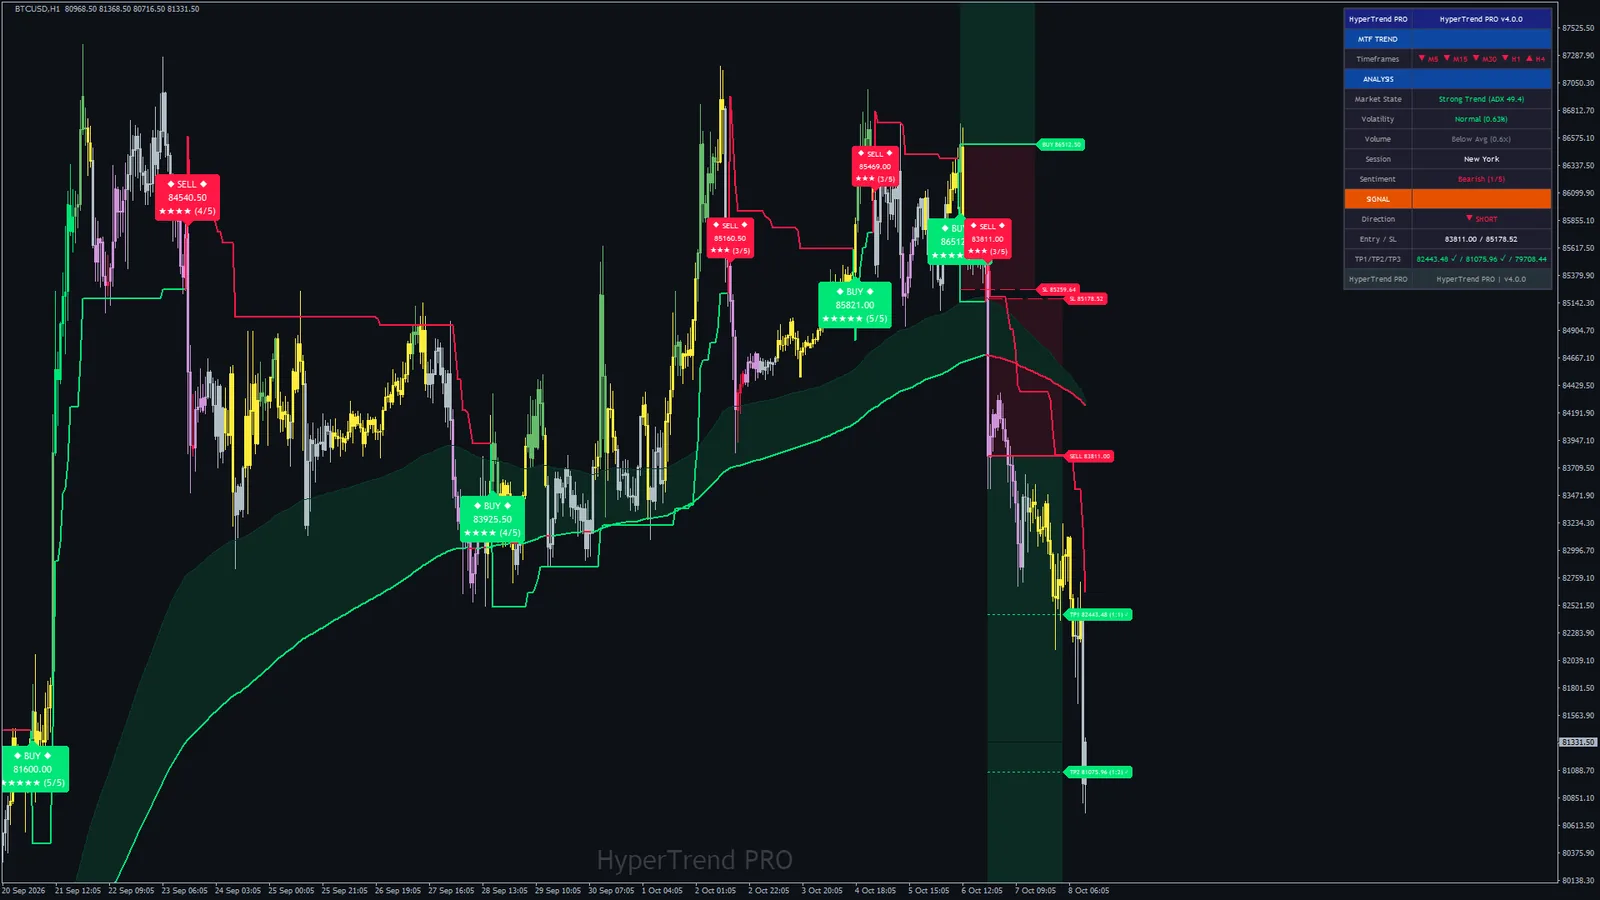
Each one was saved by MetaTrader itself from a chart of the shipped build, with the indicator attached exactly as you would attach it: the cloud, the SuperTrend and Trend Tracer lines, coloured candles, signal plates, the entry, stop and target levels and the dashboard. The charts were picked by market and timeframe, not by how the last signal turned out. Click any chart to open it full size.
Page updated 14 October 2026 · charts captured 8 October 2026 on the Blueberry Markets Pty Ltd demo feed · MetaTrader 5 build 6230, MetaTrader 4 build 1479 · default inputs
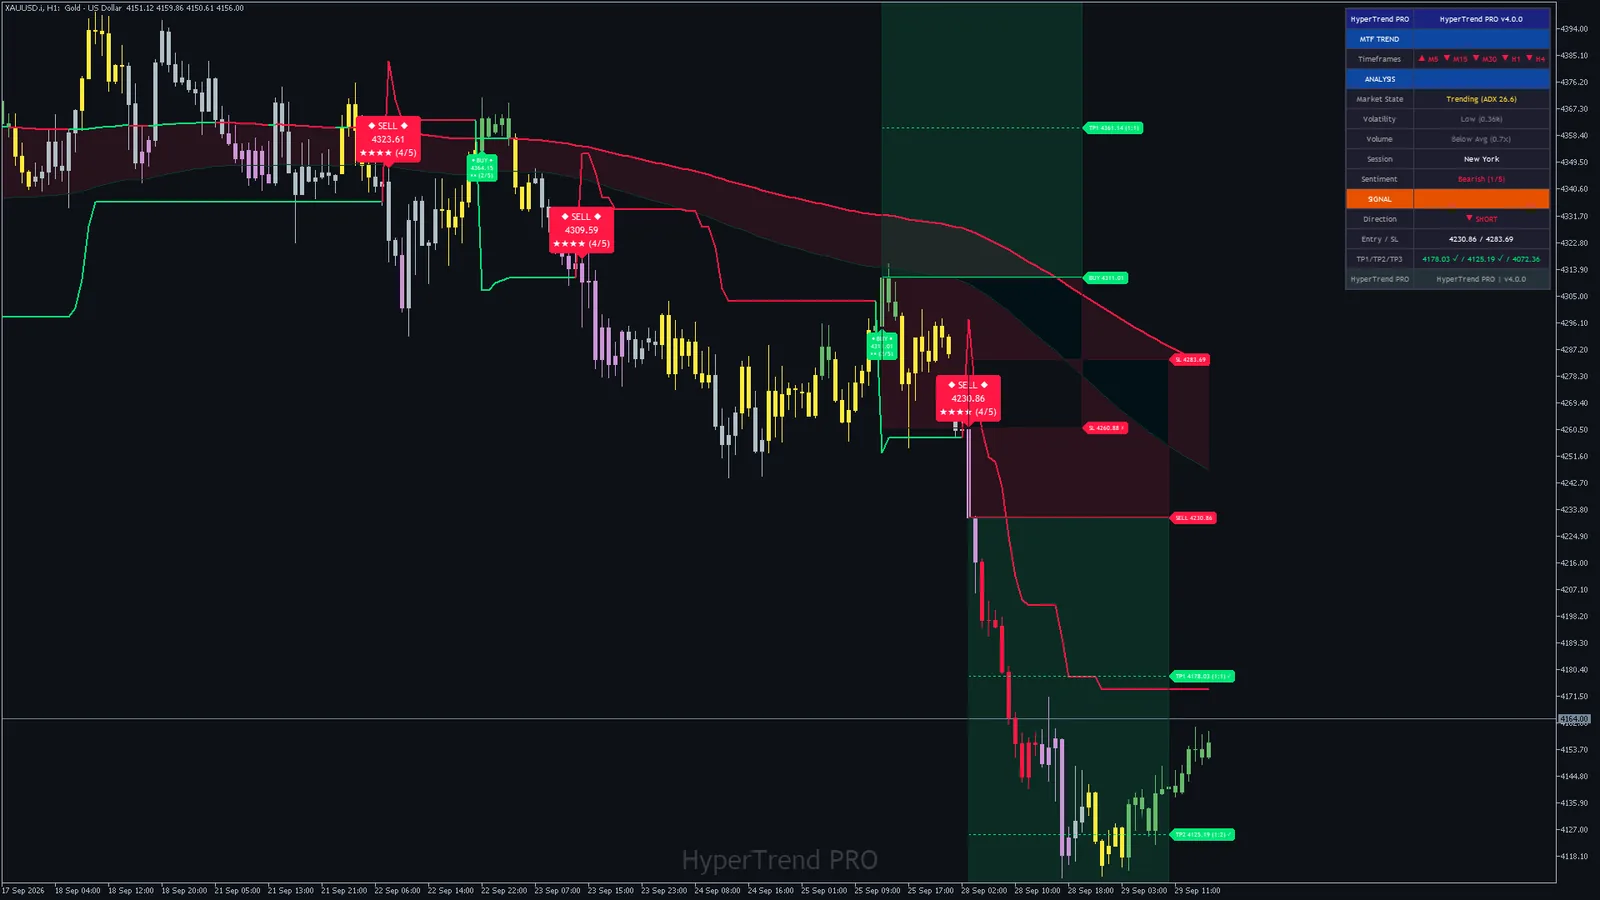
MetaTrader 5 chartEURUSD H1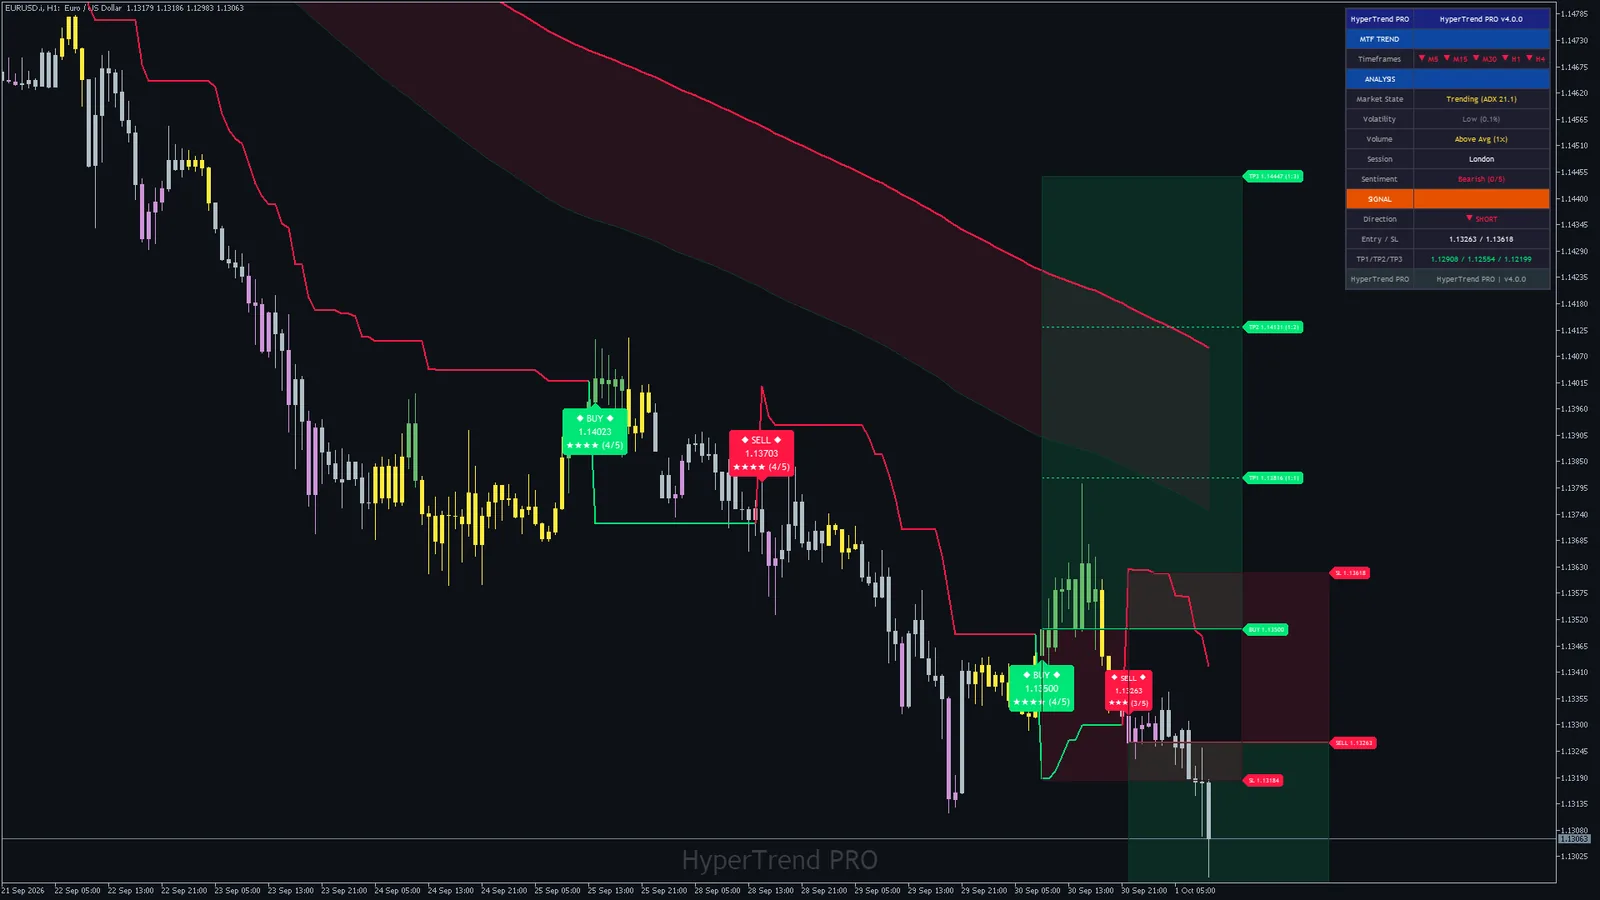 MetaTrader 5 chartGold H1
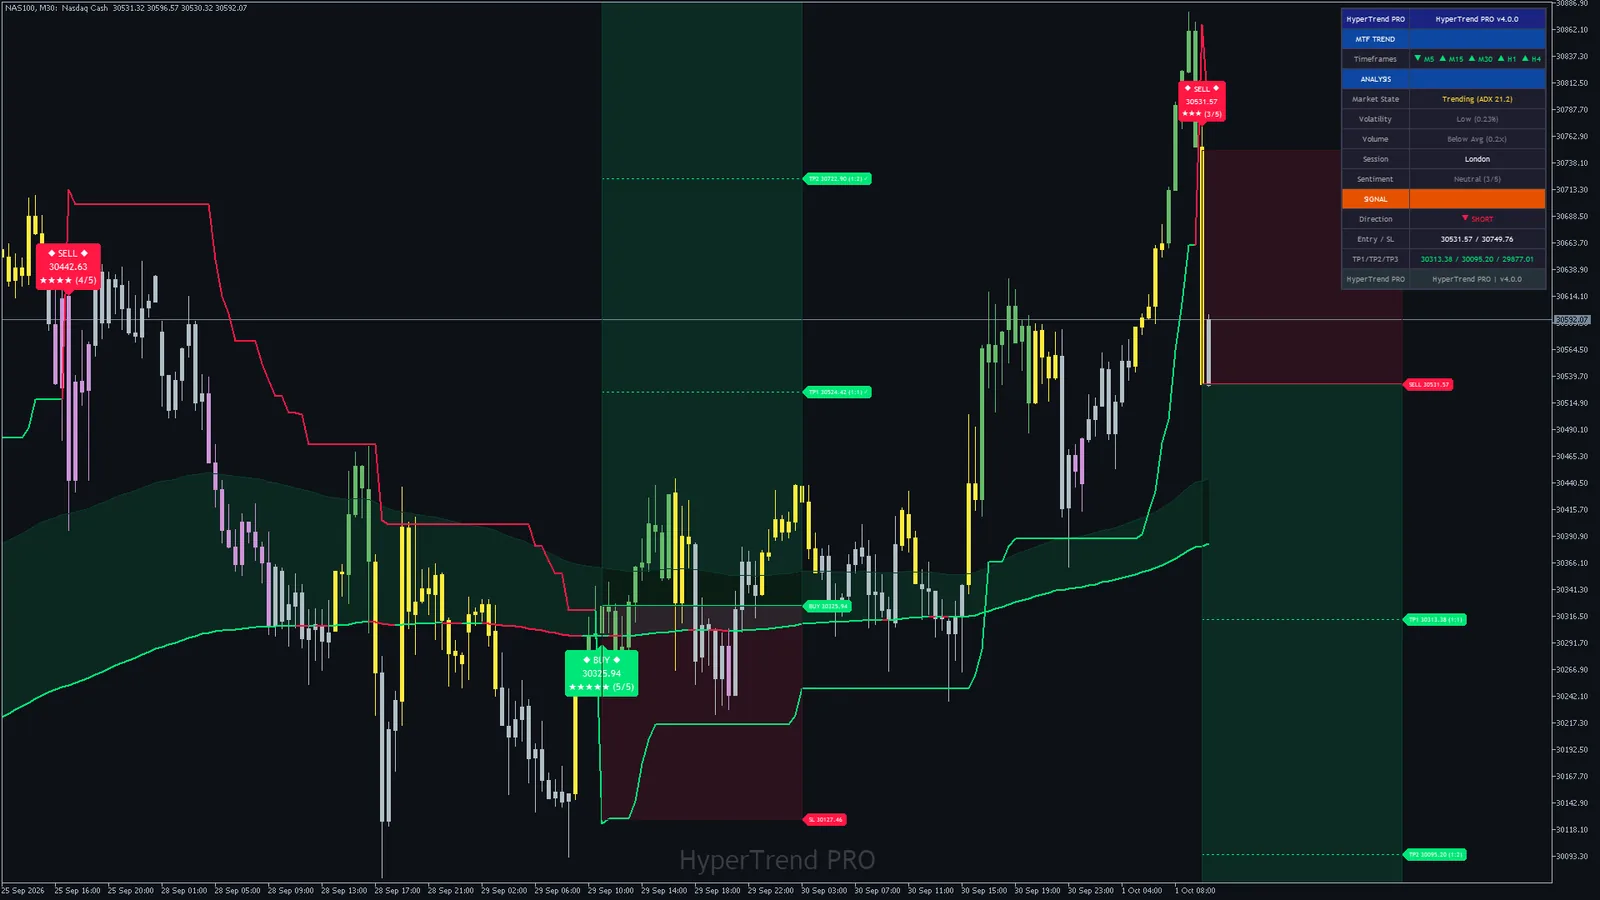
 MetaTrader 5 chartNasdaq 100 M30
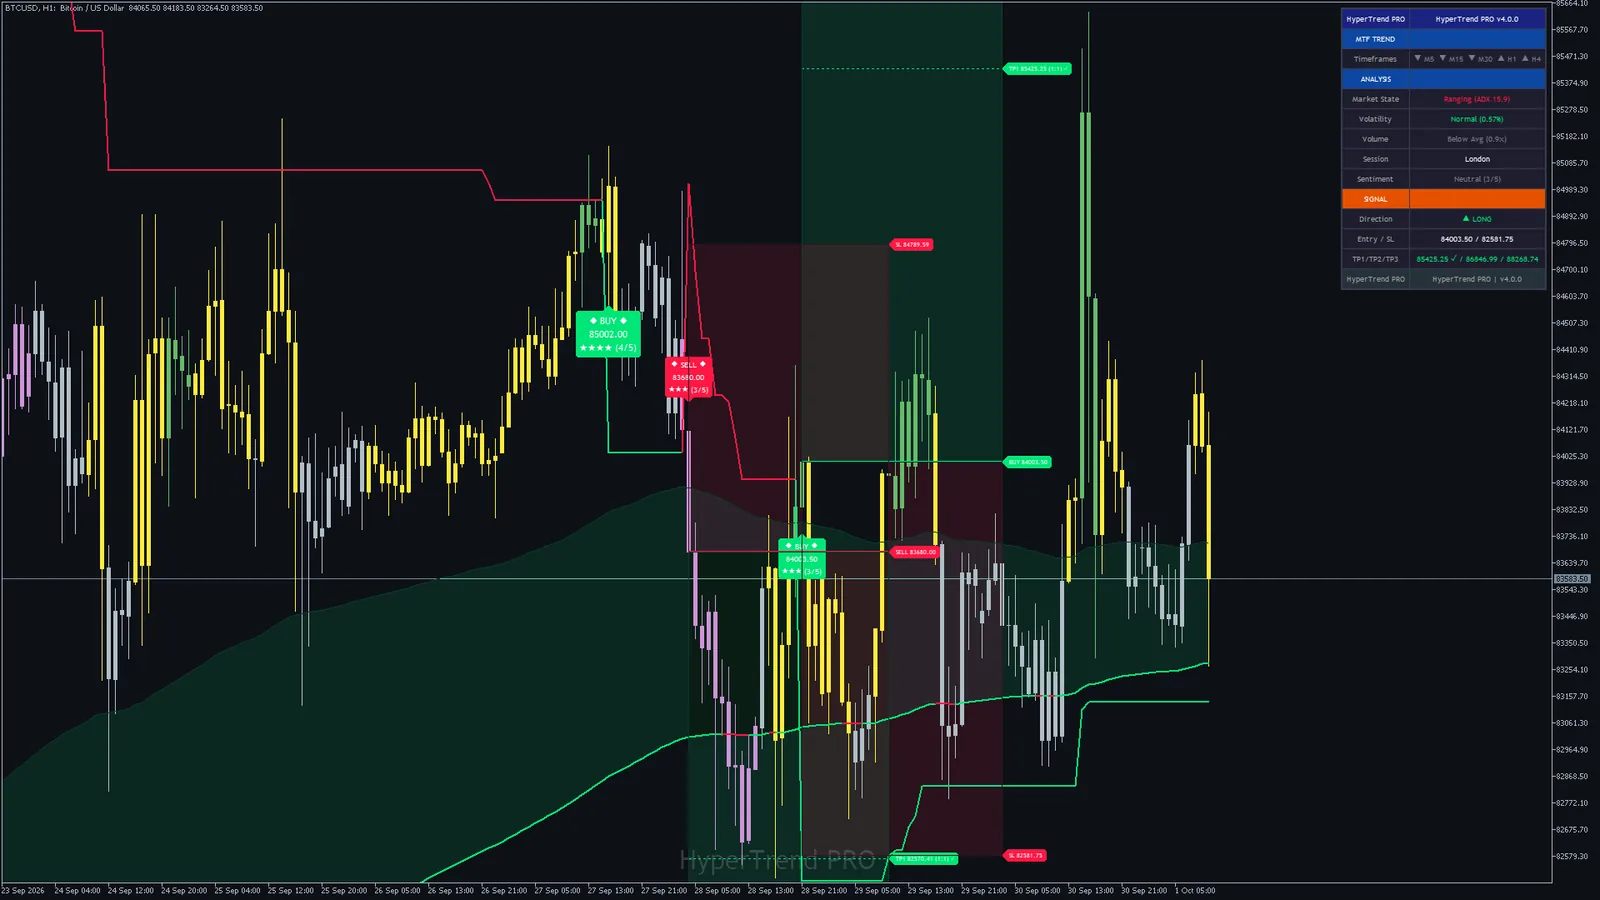
 MetaTrader 5 chartBitcoin H1
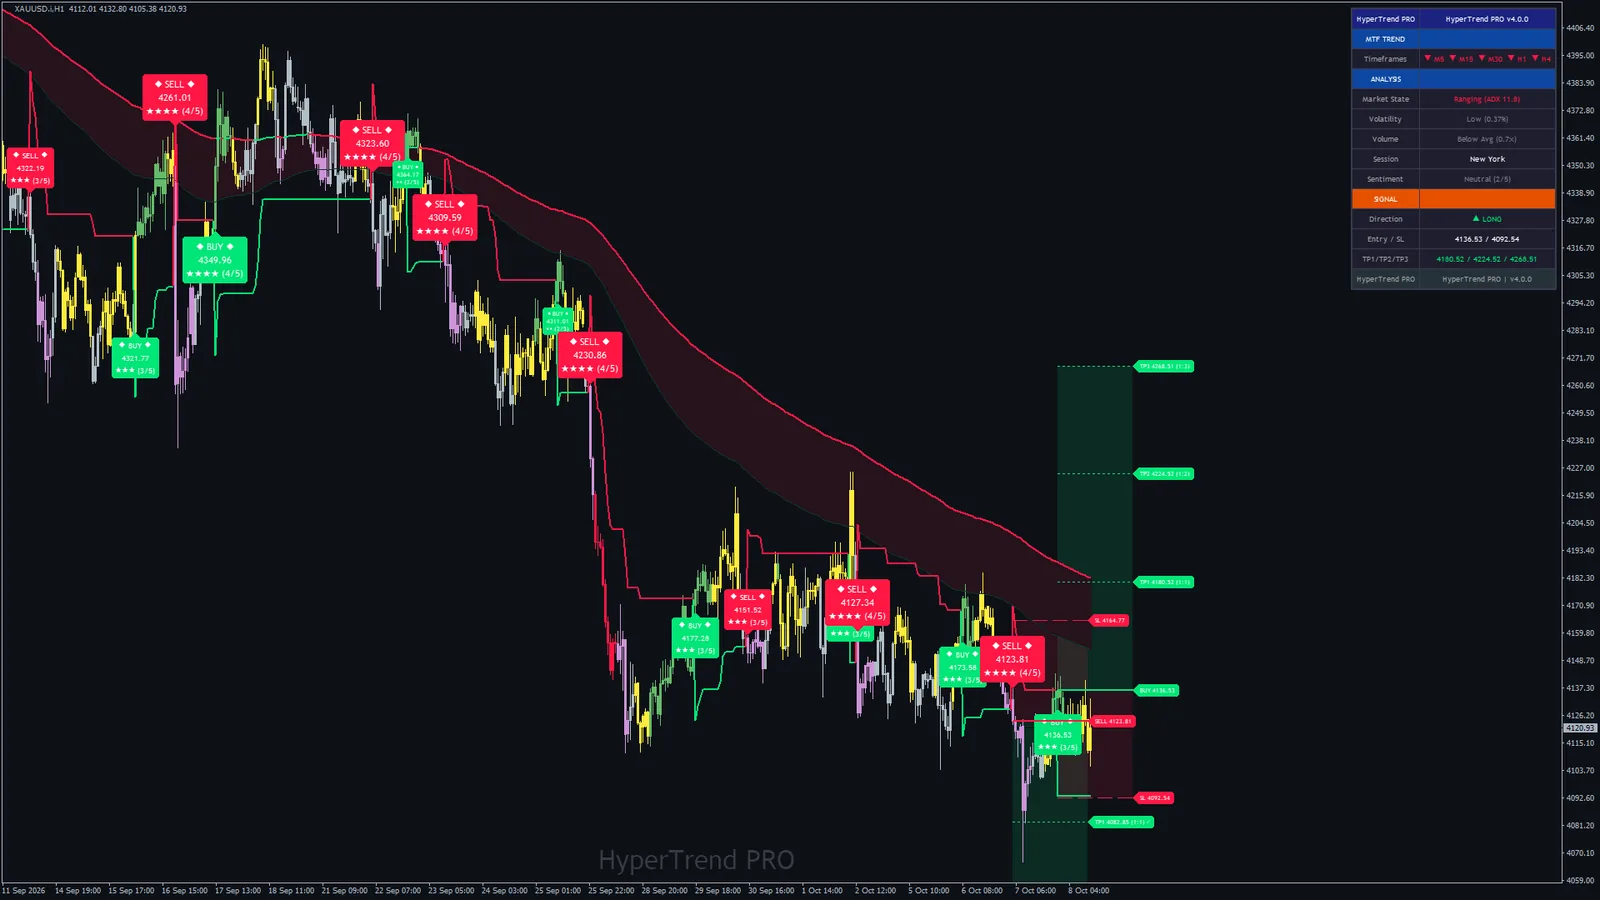
 MetaTrader 4 chartGold H1
 MetaTrader 5 chartGBPUSD M30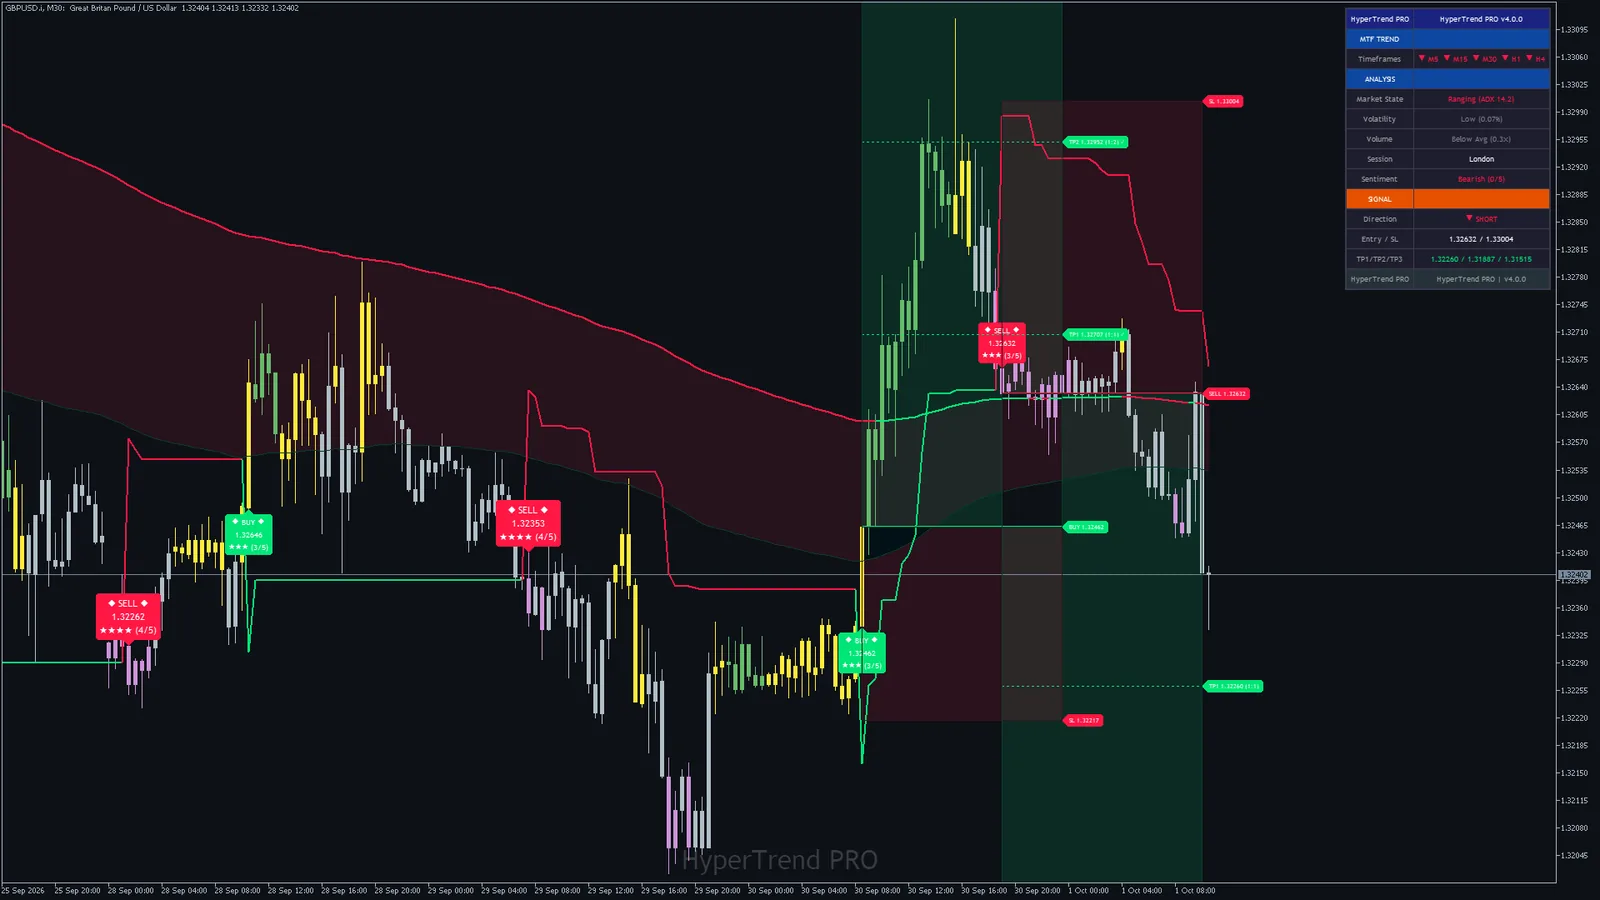
Every chart we captured, by market
Forex9 charts
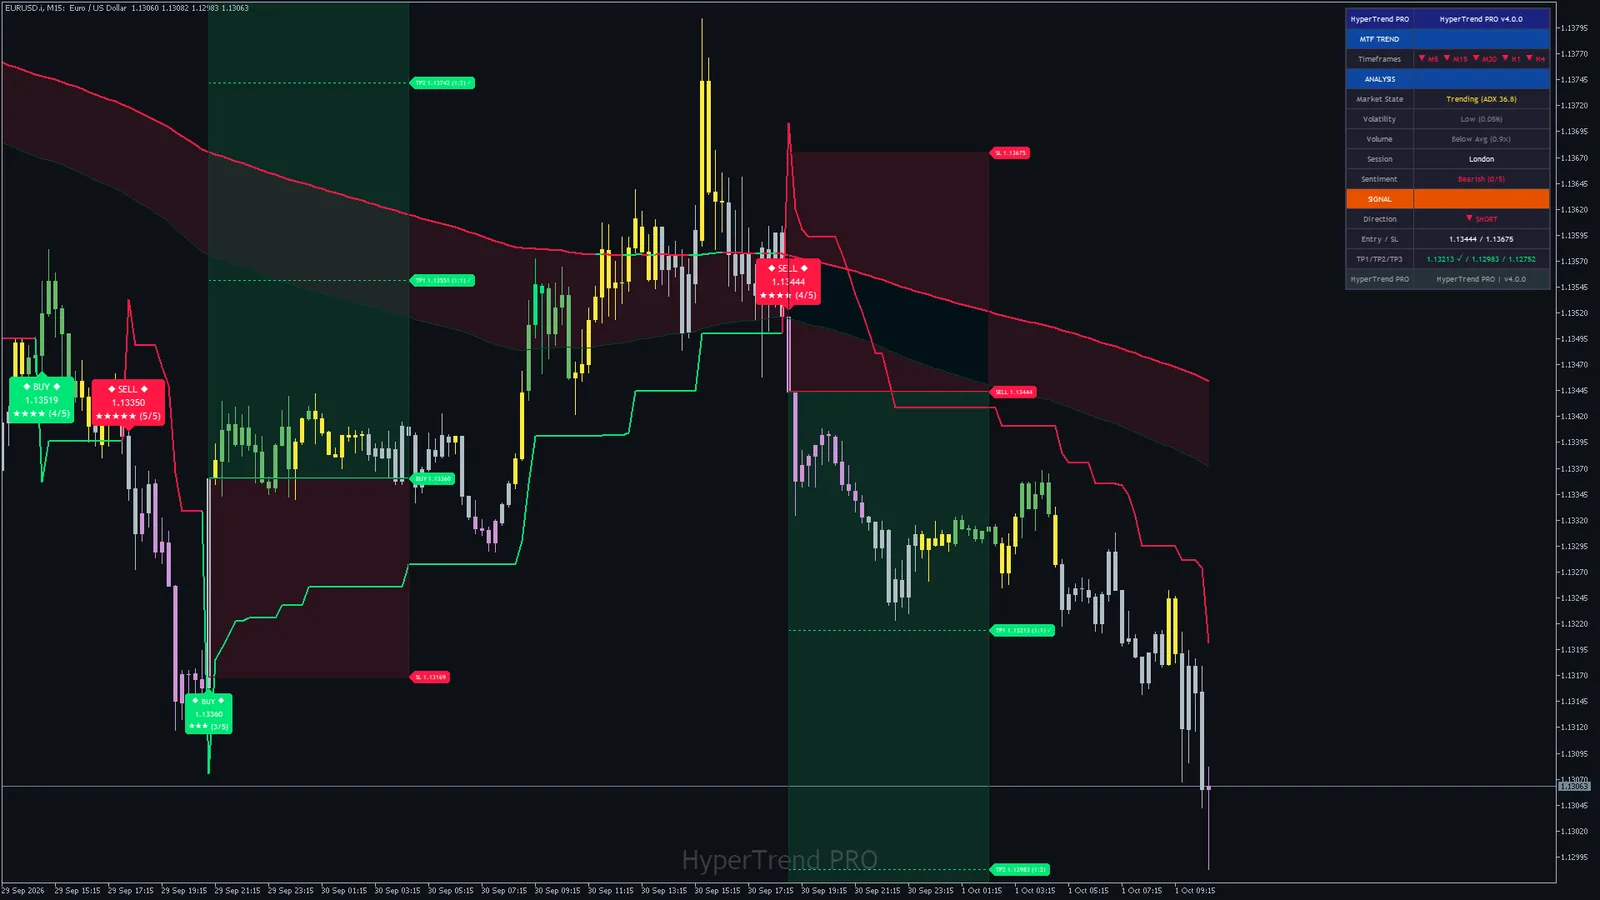
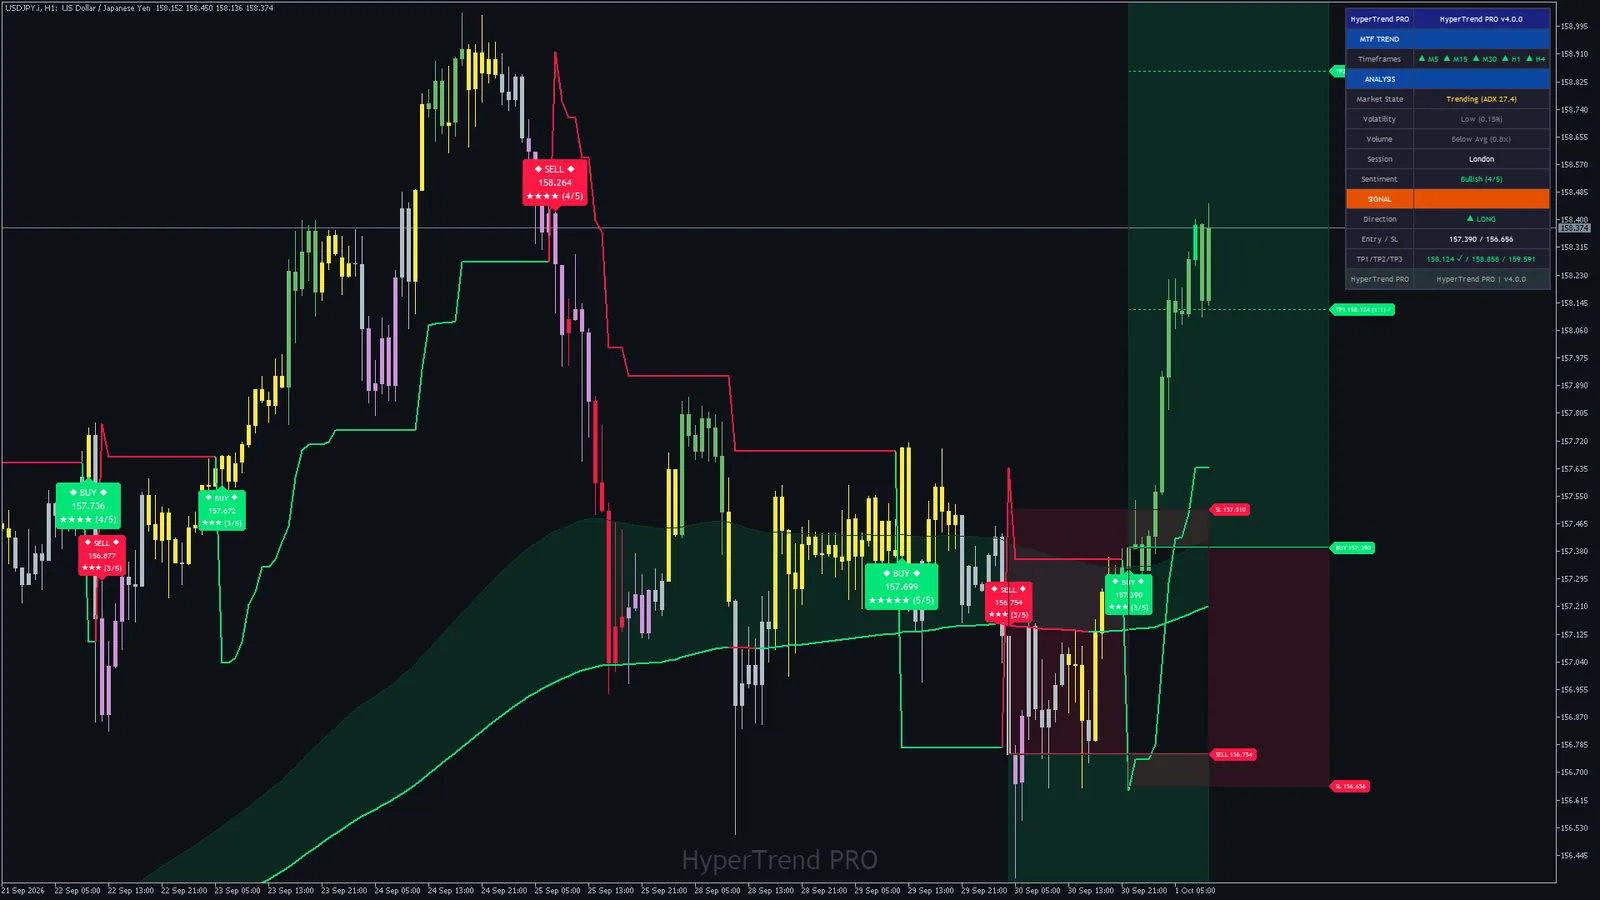
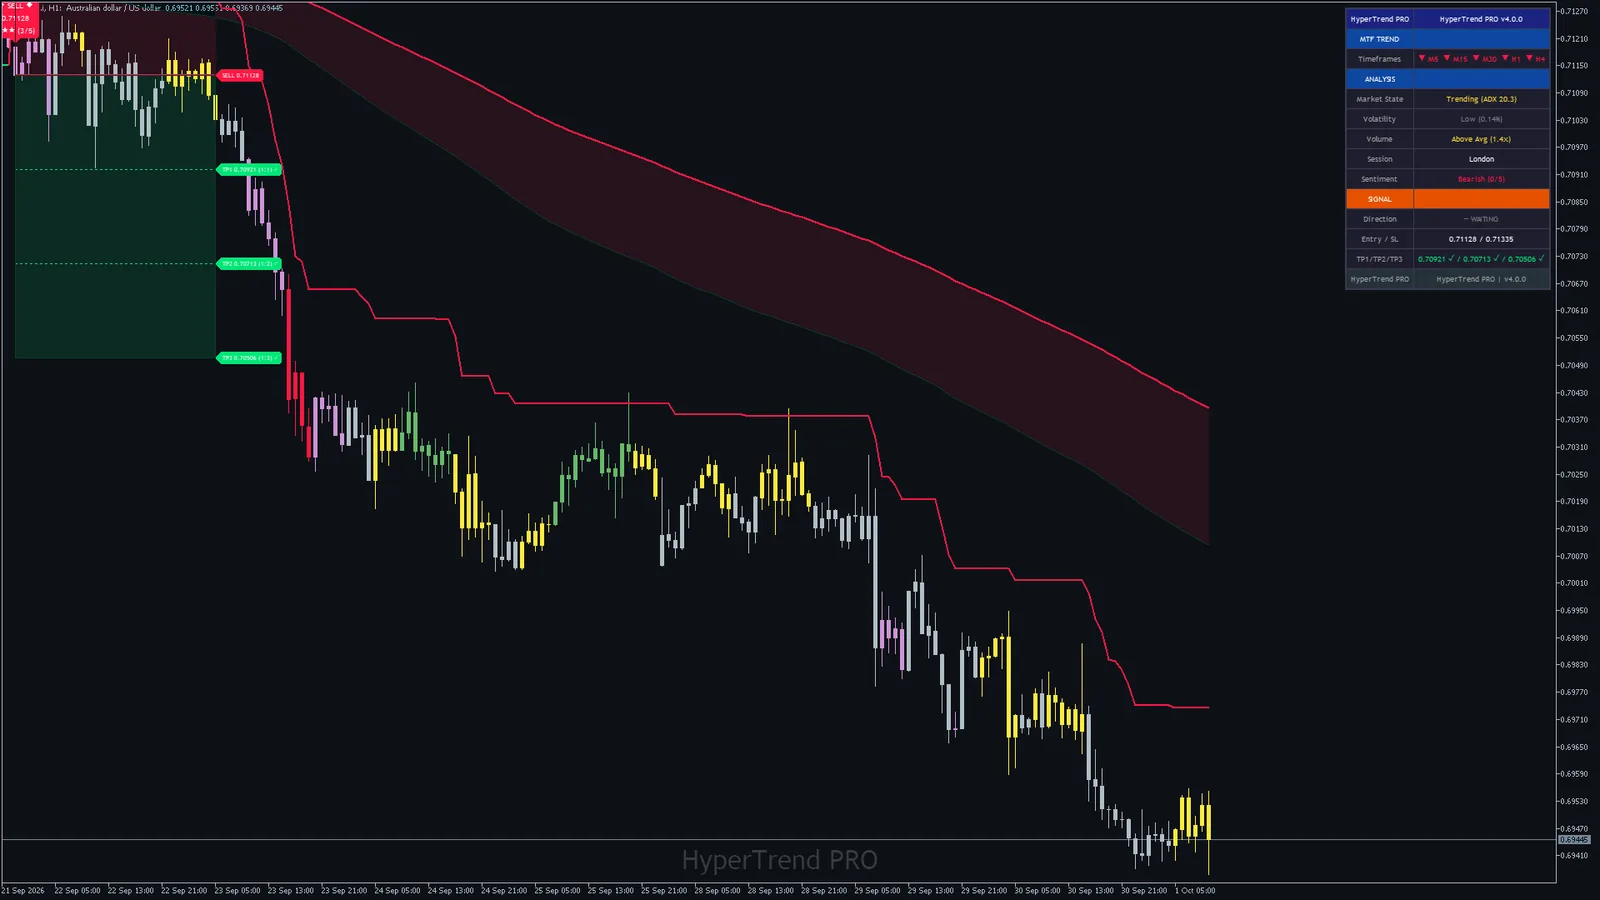
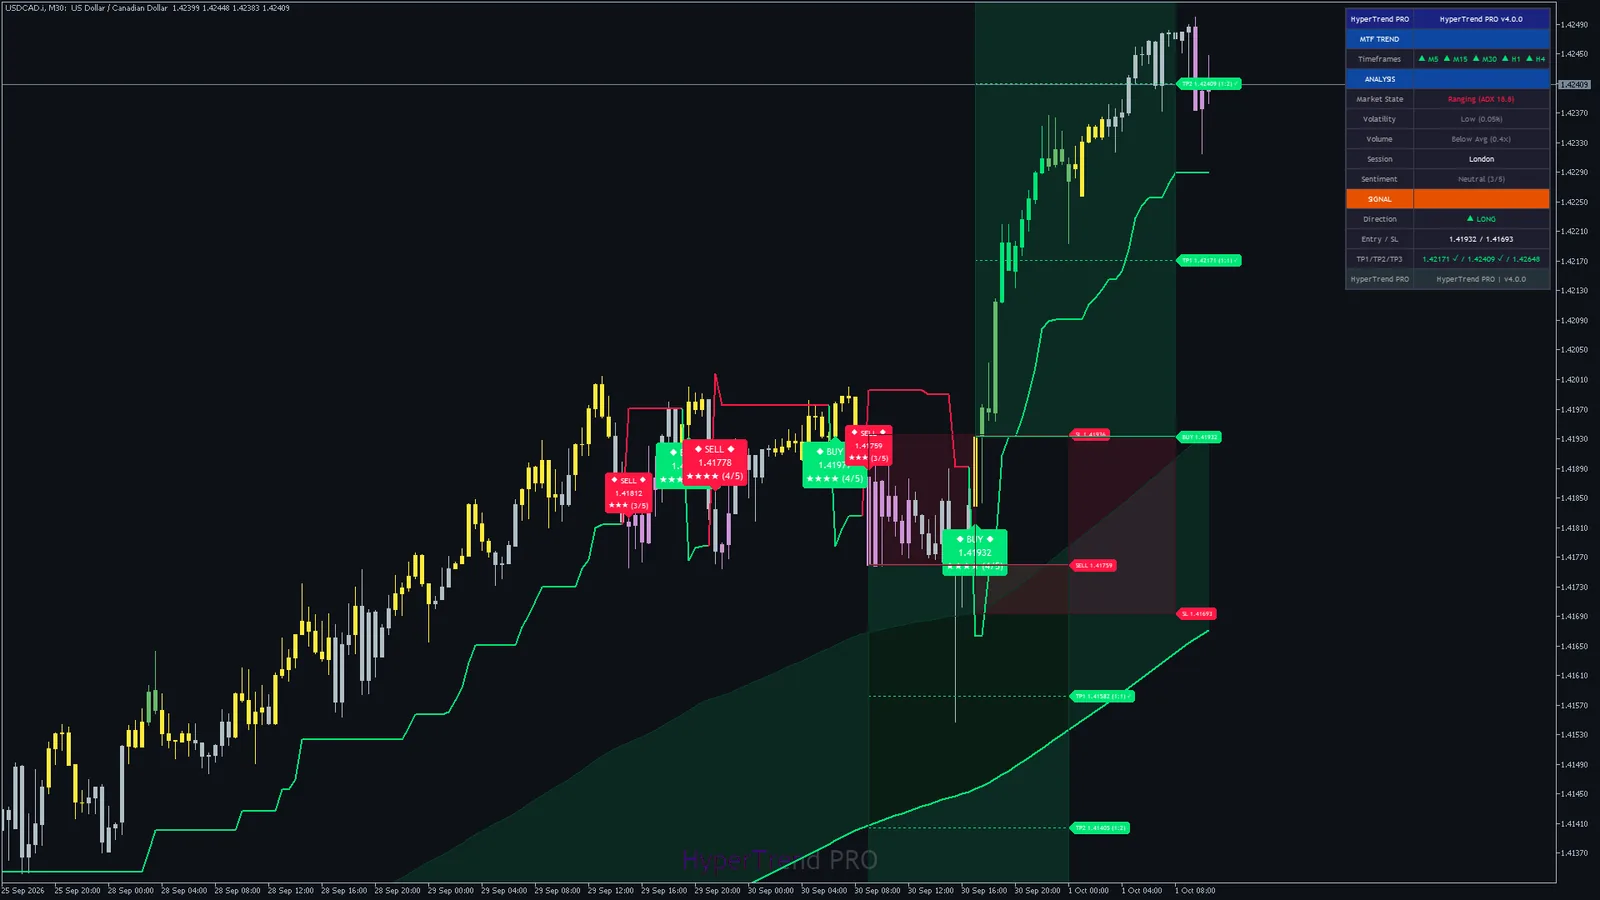
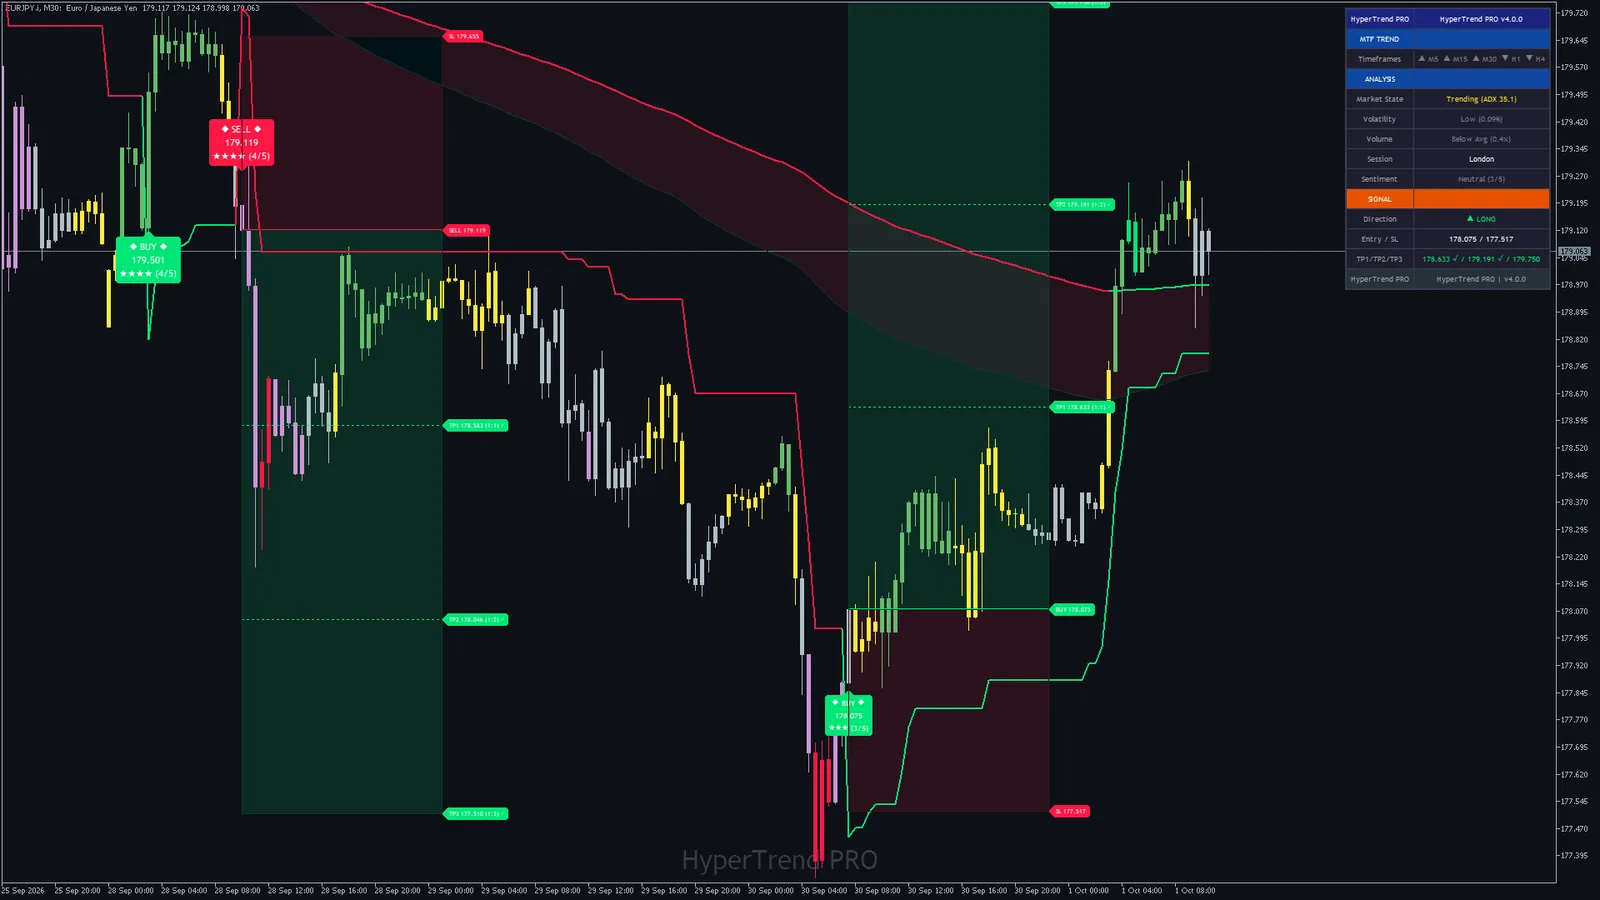
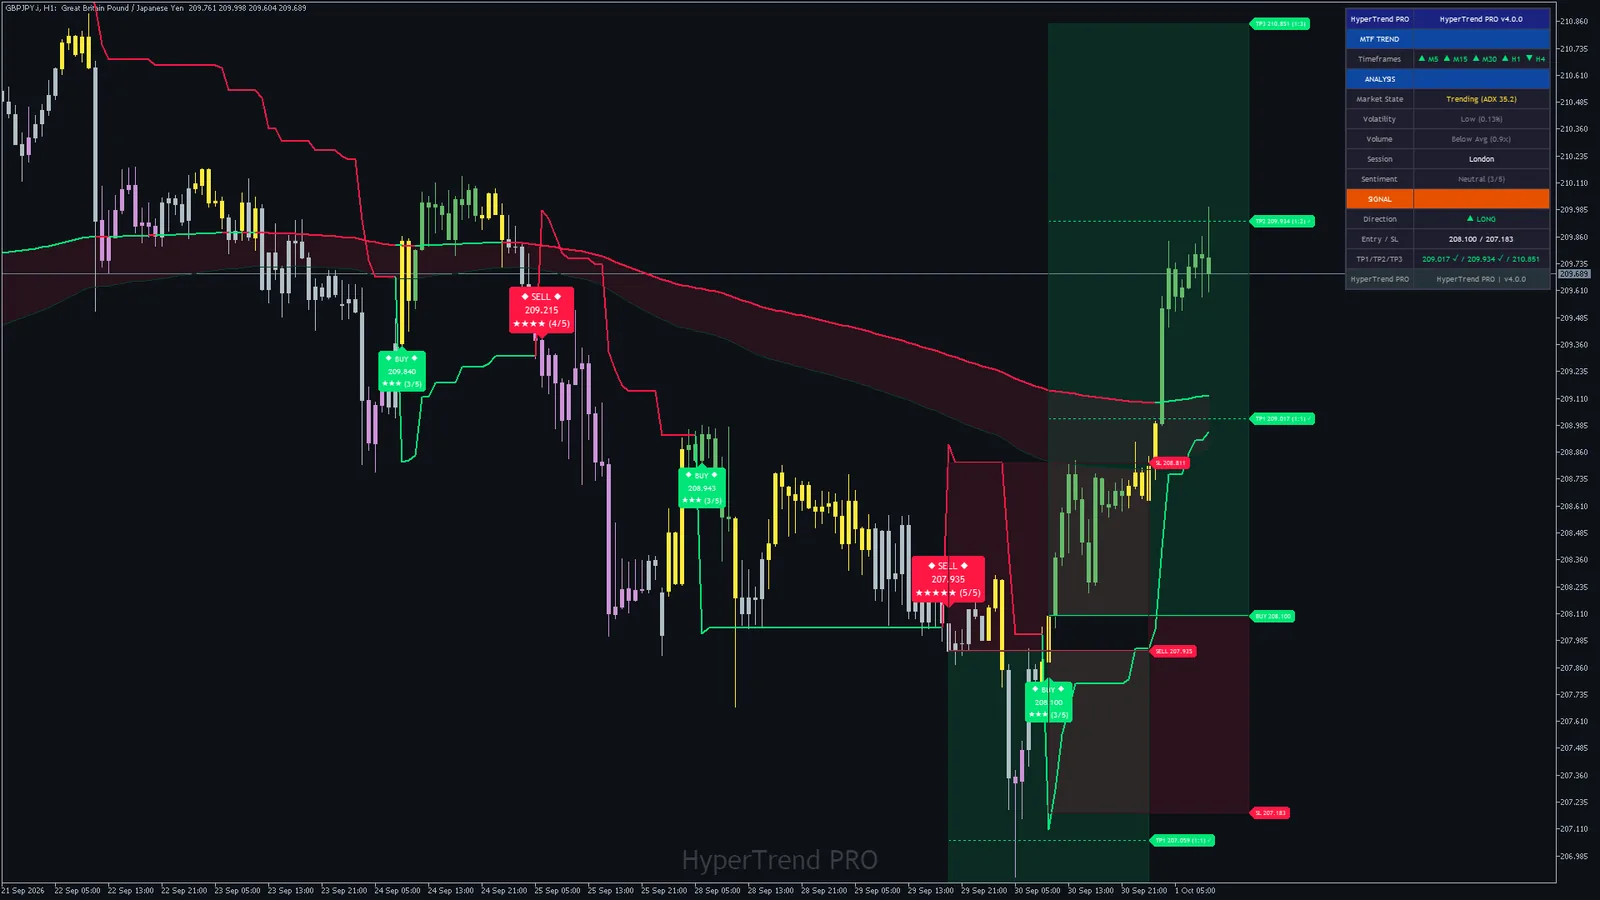
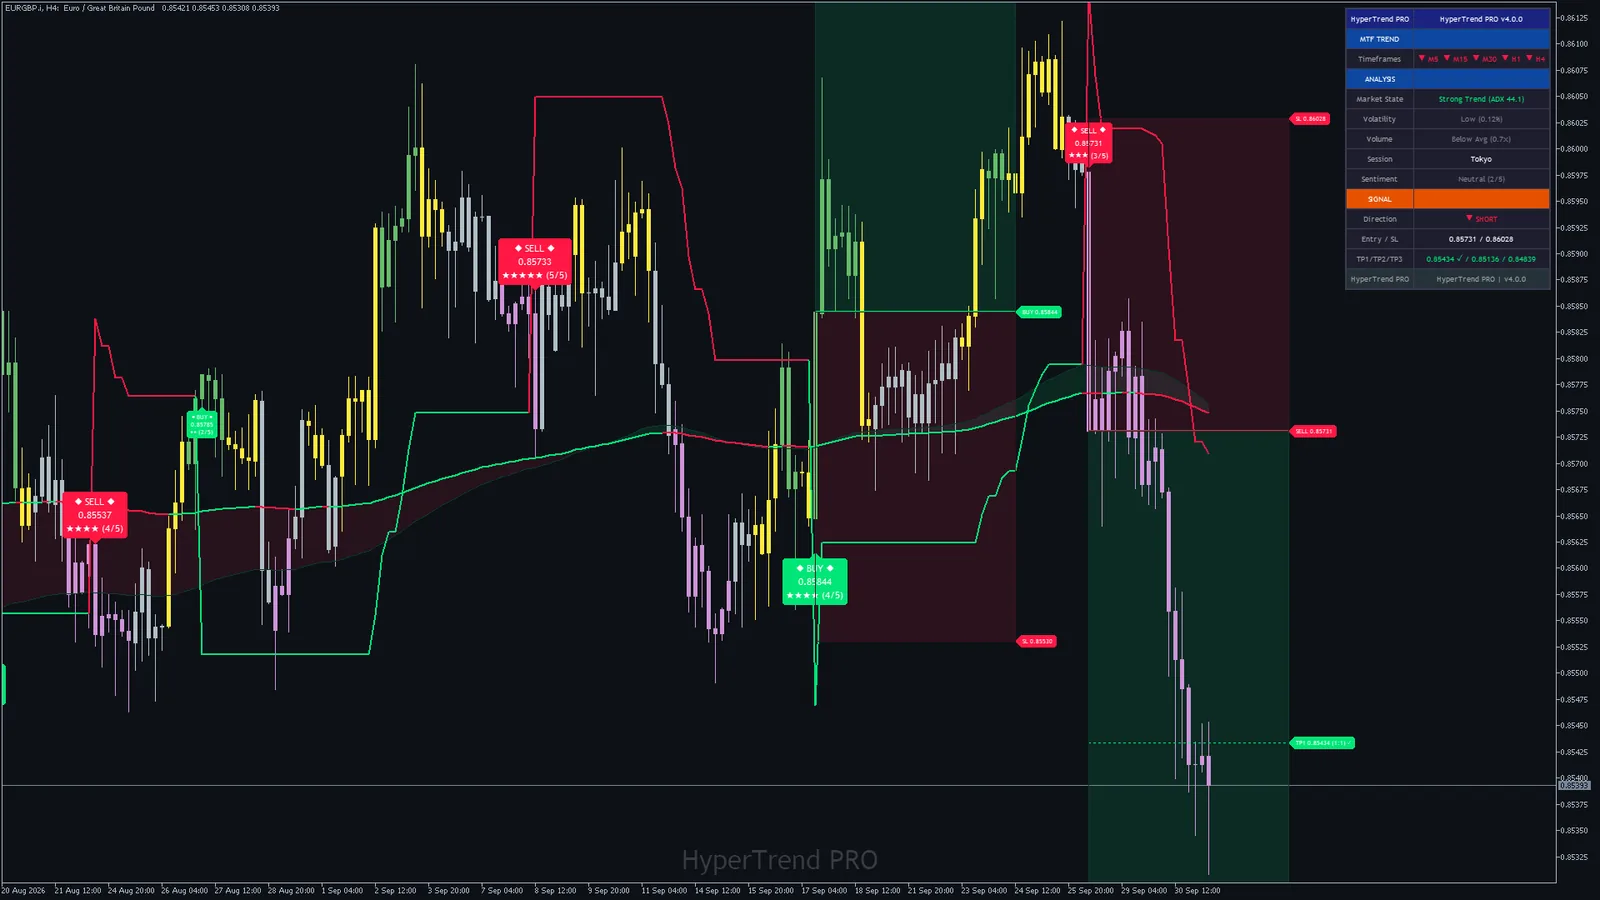
Metals and crypto6 charts
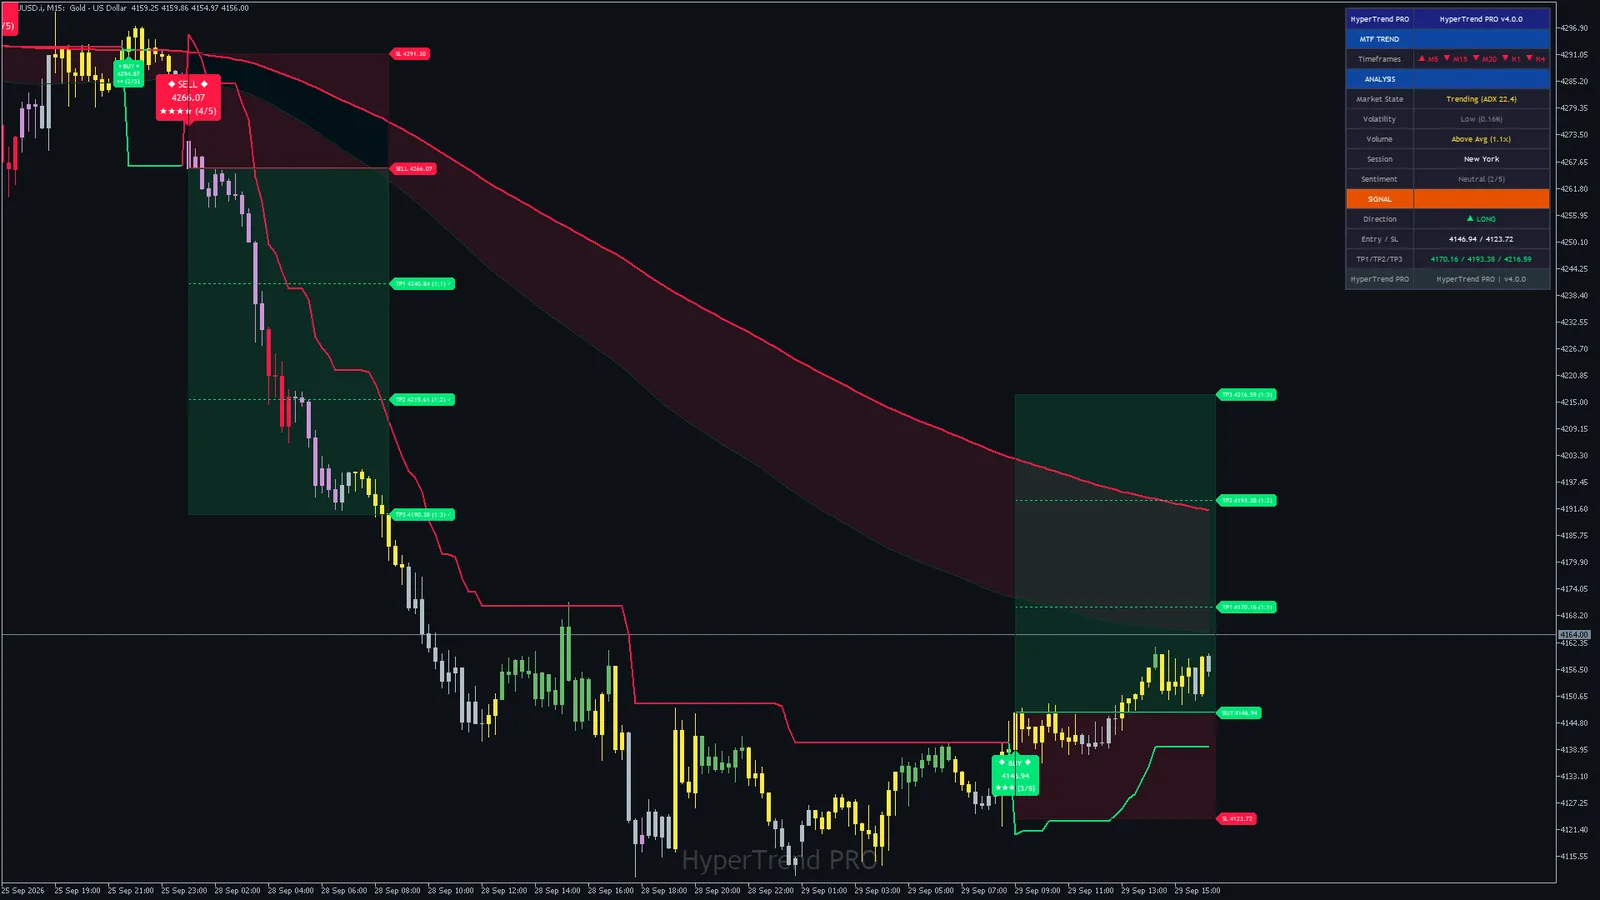
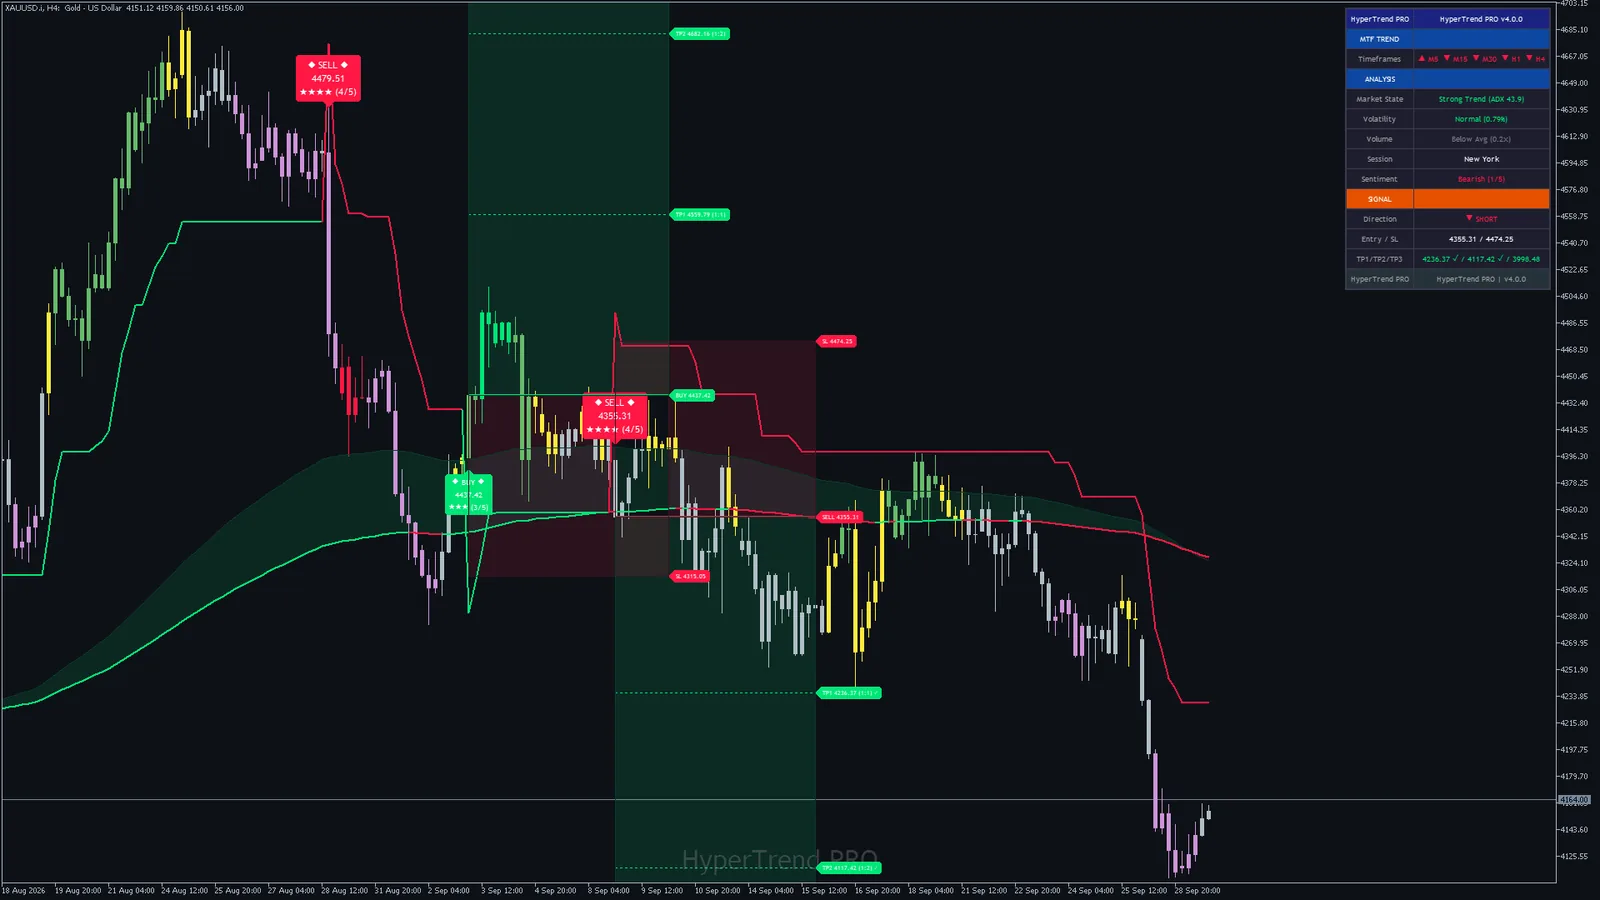
Indices and oil5 charts
MetaTrader 410 charts
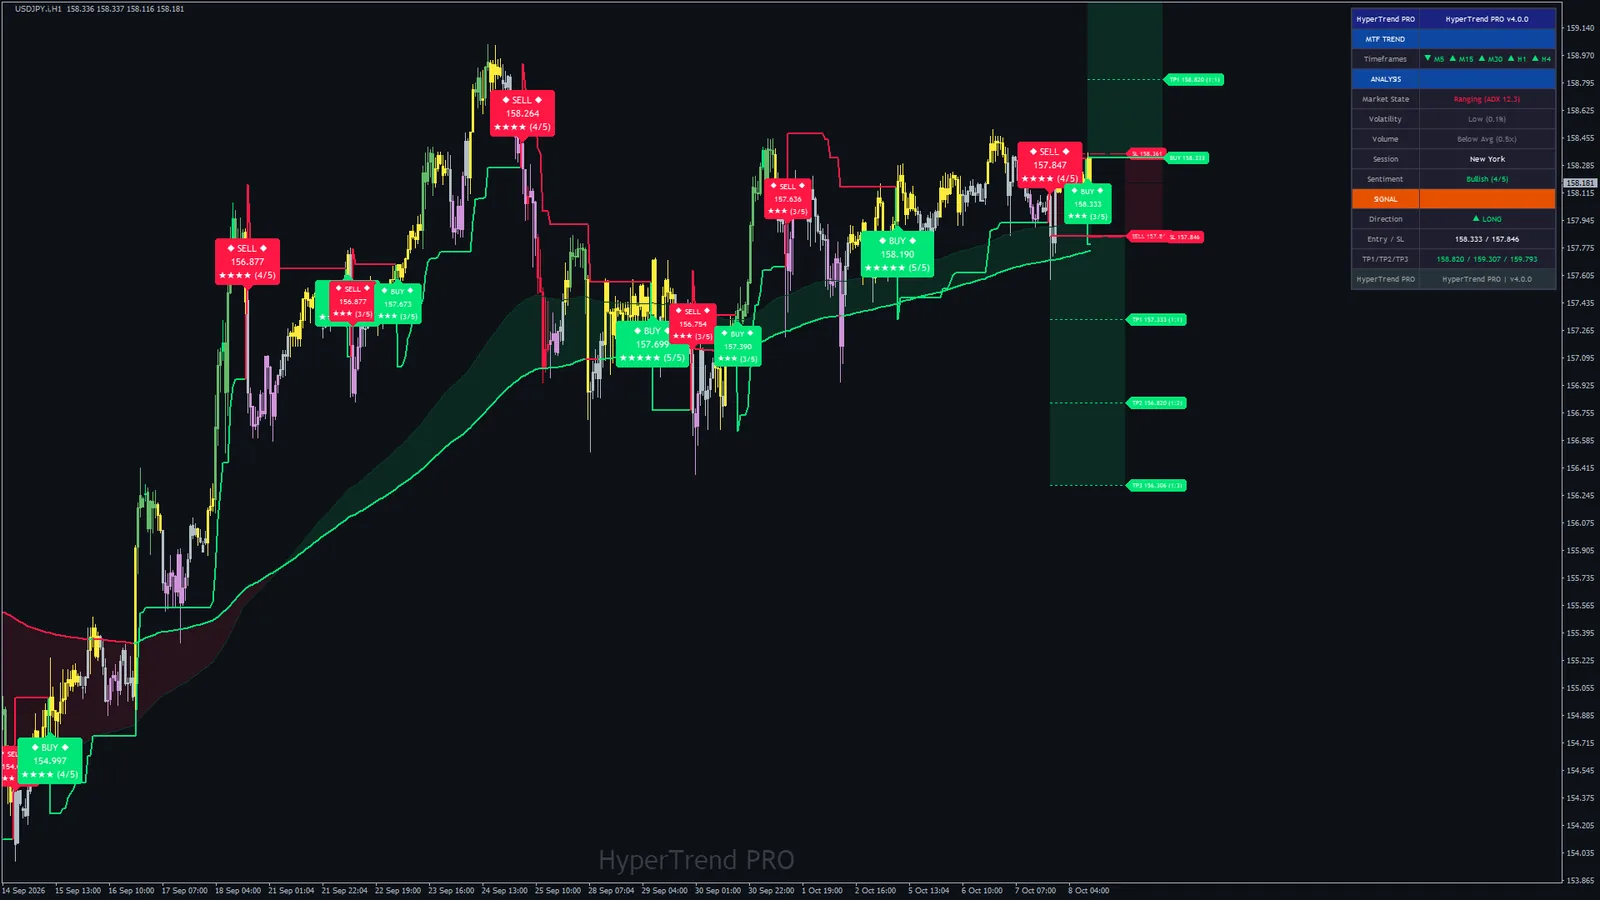
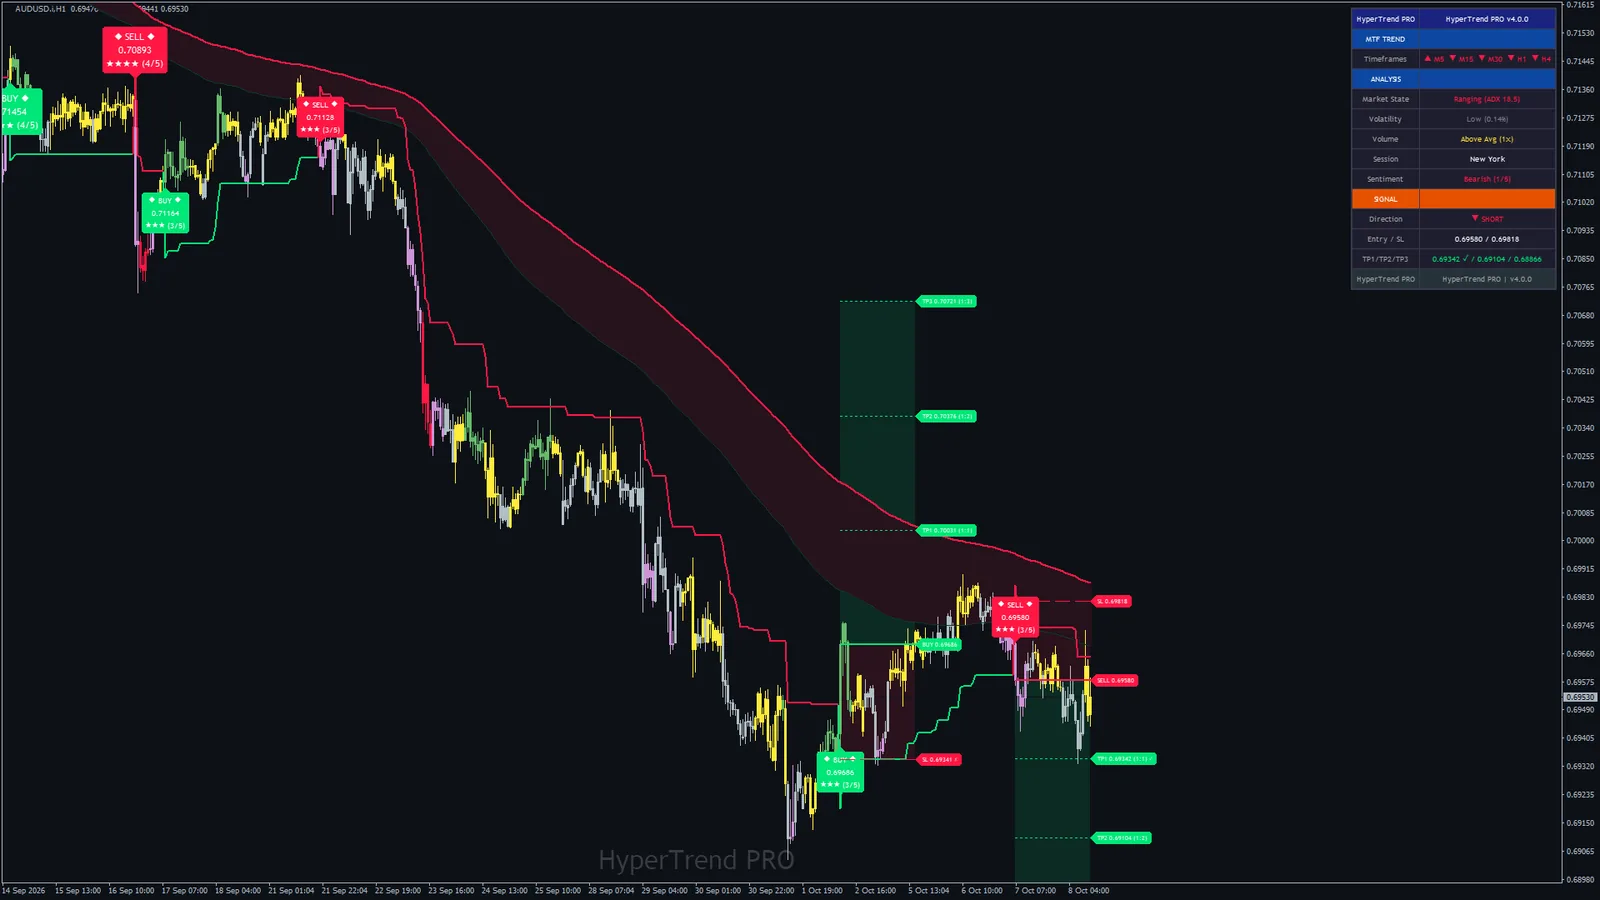
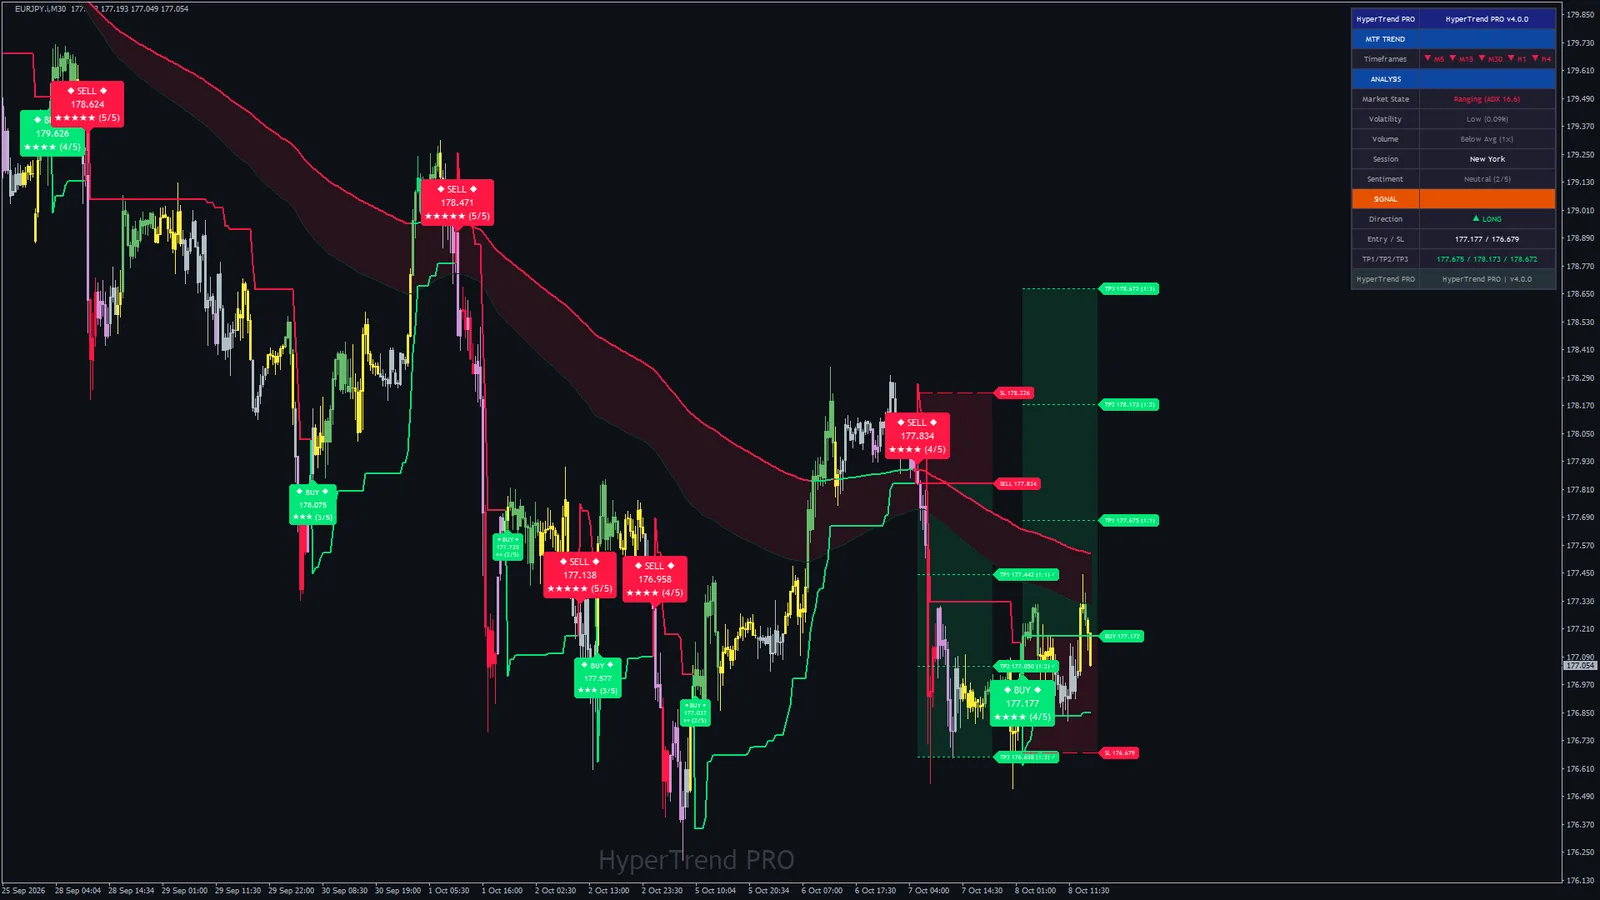
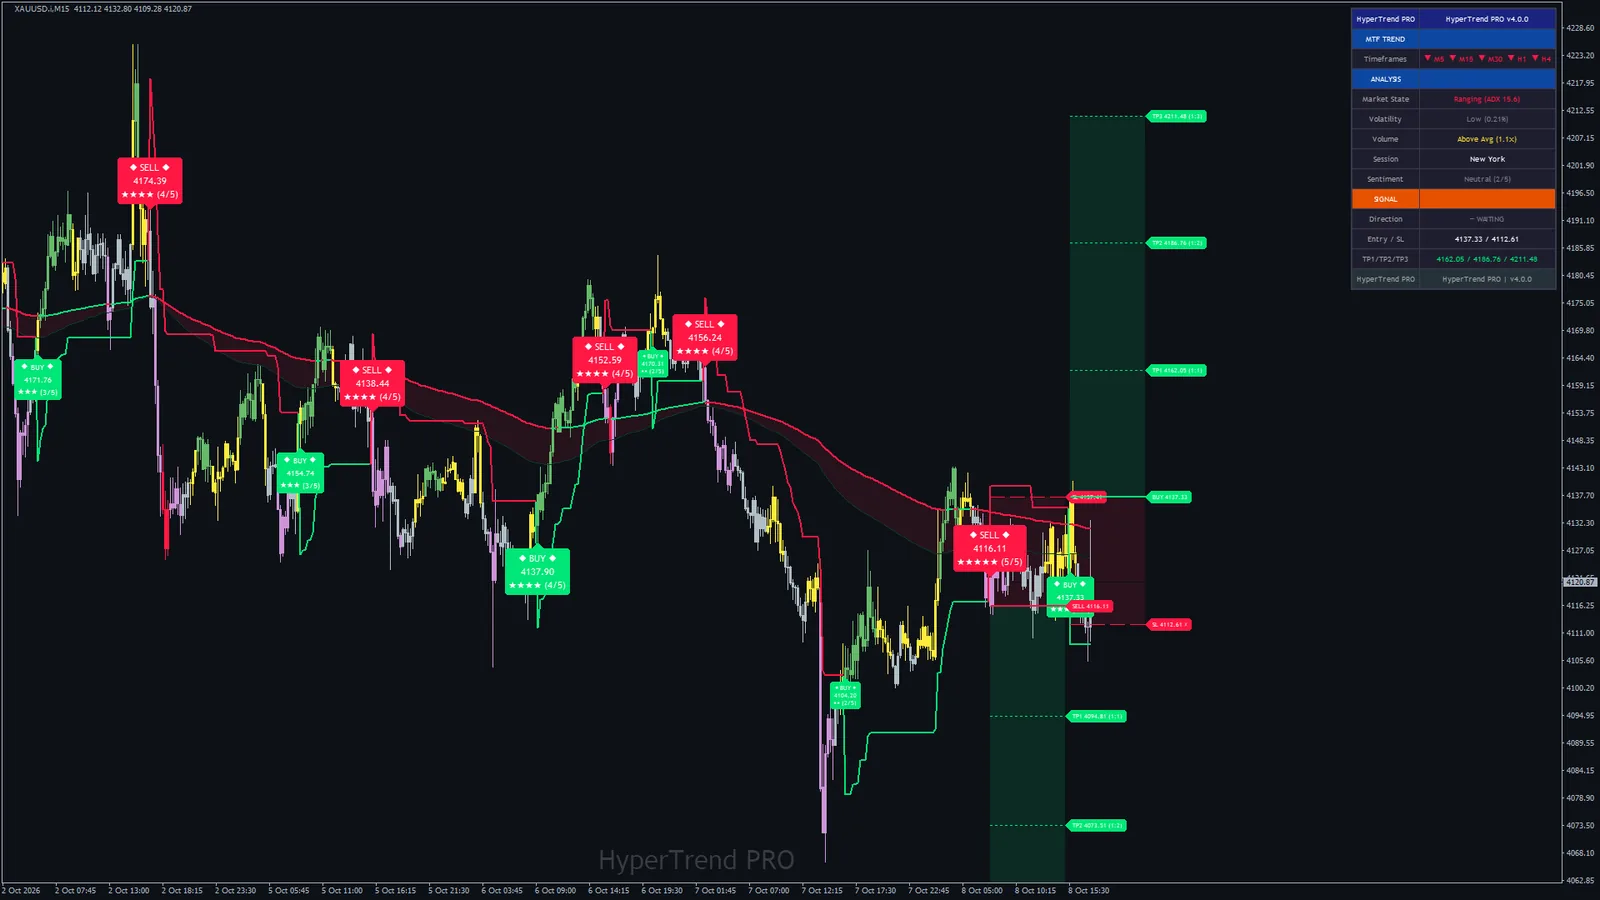
How these charts were captured. So you can repeat them, not just look at them.
- MetaTrader 5 build 6230 and MetaTrader 4 build 1479 on the Blueberry Markets Pty Ltd demo server (BlueberryMarkets-Demo), 8 October 2026. The terminals ran unattended: a helper script opened each chart, attached the shipped indicator with its default inputs, waited until the dashboard, the lines and at least one signal plate were drawn and saved the chart with MetaTrader's own screenshot function. No chart was edited afterwards.
- The MetaTrader 5 charts show the history stored in that terminal, which runs to 1 Oct 2026 (each chart's last bar is in its caption); the MetaTrader 4 charts were live up to 8 Oct 2026.
- The dashboard values, the newest signal and the signal counts on this page were computed from each chart's own bars at the moment of capture, by the same engine the indicator runs, and stored next to the screenshot, so every figure traces to a file. On every chart the All Signals count was checked against the signals the chart itself drew. Times are the broker's server time. Forex symbols on this feed carry a .i suffix.
- Every value the engine computes was compared with the original design's own output, bar by bar, on both builds: 15,991,469 values per platform, no differences. The plates, levels and dashboard text were compared the same way.
A trend, a rating and a plan
Three parts, each one visible on the chart or the dashboard, which is what makes a signal easy to check.
The trend
A SuperTrend sets its bands Sensitivity (3.1) times the 25-bar ATR away from each bar's mid price and ratchets them with the trend. A signal can only start where it flips, and only on a closed bar. The 250-period Trend Tracer and an EMA cloud show the bigger picture around it.
The stars
At the flip, five checks each add a star when they agree with it: the MACD histogram rising (falling for a SELL), EMA 150 above EMA 250 (below for a SELL), ADX above 20, volume above its 20-bar average and the Hull 55 line rising (falling). The preset sets the minimum: All Signals 0, Trend Scalper 2, Quality+ 3, Strong+ 4.
The plan
The signal bar's close is the entry. The stop sits one risk away, where the risk is ATR times Sensitivity, and the three targets at 1.0, 2.0 and 3.0 times that risk. Each target is ticked when price trades through it; the stop or the third target ends the trade.
Install the file for your platform
Copy the .ex4 into MQL4/Indicators or the .ex5 into MQL5/Indicators, refresh the Navigator and drag Hyper Trend PRO onto any chart.
Choose your preset
All Signals shows every flip with its stars. Move to Quality+ or Strong+ when you want fewer, better-backed signals; the manual has starting points per market.
Read the dashboard
Five timeframes, the market state, volatility, volume, the session, a sentiment score and the entry, stop and targets of the last signal.
Let the alerts call you
Seven of the nine alert events are on by default: BUY, SELL, the stop, each target and a trend change, by popup, sound, push to the MetaTrader app or e-mail, on closed bars only.
The market, read for you, and every signal's plan on the chart
A signal you can check is a signal you can judge. The panel reads the market on this chart and five timeframes; the levels show where the last signal is right and where it is wrong.
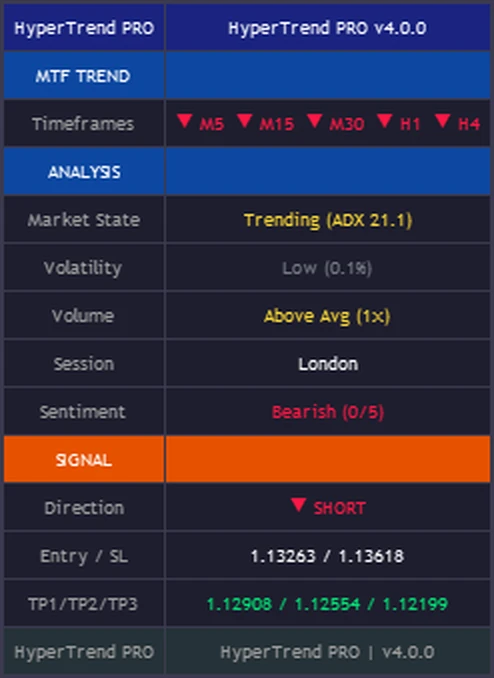
| Row | What it shows |
|---|---|
| Header | The product name and version |
| MTF TREND | Section header |
| Timeframes | An arrow per timeframe: is the close of the last closed M5, M15, M30, H1 and H4 bar above its 200 EMA? Green when 4 or 5 point up, red when 4 or 5 point down, grey in between |
| ANALYSIS | Section header |
| Market State | Strong Trend above ADX 40, Trending above 20, otherwise Ranging, with the ADX |
| Volatility | High when ATR is above 1.5 percent of price, Normal above 0.5, otherwise Low, with the figure |
| Volume | Spike above twice the 20-bar average, Above Avg over it, otherwise Below Avg, with the ratio |
| Session | New York, London, Tokyo or Sydney by the UTC hour |
| Sentiment | A second score out of 5: SuperTrend direction, the EMA 150/250 pair, the Hull slope, the MACD histogram and the timeframe majority. Bullish at 4 or 5, Neutral at 2 or 3, Bearish at 0 or 1 |
| SIGNAL | Section header |
| Direction | LONG or SHORT while a trade is tracked, WAITING after its stop or third target |
| Entry / SL | The entry and stop of the last signal |
| TP1/TP2/TP3 | The three targets, each with a tick once price has traded through it on the loaded chart |
| Footer | The product name and version |
A tick next to a target is a reading of the chart: price traded through that level on the loaded history. There is no spread, commission or slippage in it and it is not a filled order. The trade rows keep the last signal until the next one prints.
The same engine, drawn two ways
Both builds run the same engine on the same inputs and produce the same signals, stars, levels, alerts and dashboard values; we checked that value by value. The plates, the levels and the dashboard are drawn the same way on both. What differs is how each platform draws the cloud, the candles and the two-colour lines. Here is Gold H1 on both. The two charts show different dates: the MetaTrader 5 history on this computer ends on 29 Sep 2026, the MetaTrader 4 chart ran live to 8 Oct 2026.
| MetaTrader 4 | MetaTrader 5 | |
|---|---|---|
| Signals, stars, levels and alerts | Identical | Identical |
| Dashboard values | Identical | Identical |
| Signal plates, price tags and dashboard | Drawn as images, identical | Drawn as images, identical |
| Cloud and coloured candles | Histogram bars | Filled cloud and colour candles |
| SuperTrend and Trend Tracer colours | Two lines that meet at each flip | One two-colour line |
| Alerts | Nine events, popup, sound, push, e-mail | Nine events, popup, sound, push, e-mail |
Three things a trend indicator should do, done properly
Signals you can rank
Every signal carries its stars, so you can see at a glance which flips had momentum, trend, strength, volume and slope behind them, and set the minimum you are willing to act on.
A plan with every signal
The entry, the stop and three targets are drawn the moment a signal prints, with their prices on the chart and on the dashboard. You know where you are wrong before you are in.
Both platforms, one purchase
The .ex4 and the .ex5 come in the same download with a manual for each, so moving between MetaTrader 4 and 5 costs nothing.
Hyper Trend PRO next to the usual options
Where it wins, and where it does not. A tool that claims to win everywhere is the one to distrust.
| Hyper Trend PRO | A free SuperTrend | A plain moving-average cross | |
|---|---|---|---|
| Signal stays where it printed | Decided on the closed bar | Can flip and flip back before the bar closes | On the closed bar, if you wait for it |
| Rates each signal | 0 to 5 stars from five checks | No rating | No |
| Stop and targets drawn for you | Entry, stop and three targets on every signal | The line only | No |
| Lets you filter weak flips | Star minimum, plus ADX, volume, cloud and RSI filters | No | No |
| Stop at market structure | No. The stop is ATR times Sensitivity from the entry, not a swing high or low | The line itself | No |
| Sizes and places the trade | No. You choose the size and place the order | No | No |
Honest about who this fits
A good fit if you
- Trade with the trend and want the entry, stop and targets on the chart the moment a signal prints.
- Want to see how much backs a signal, and to choose your own minimum.
- Trade forex, gold, silver, indices, oil or crypto on MetaTrader 4 or 5, on anything from M15 to H4.
Not for you if you
- Want an Expert Advisor that places trades for you. This is an indicator: it rates, draws and alerts, and you place the orders.
- Want stops at swing highs and lows. These stops are a fixed multiple of the ATR, or a percentage of the entry if you prefer.
- Expect a win rate printed on the box. This page shows what the indicator does, not a promise of profit.
63 inputs, each one explained
The names are the ones you see in the MetaTrader inputs dialog. The defaults are what every chart on this page uses.
| Input | Default | What it does |
|---|---|---|
| Appearance | ||
| Bull Color | #00E676 | Colour of everything bullish: BUY plates, the bullish cloud, the SuperTrend and Trend Tracer when they point up, target lines, the reward box and the dashboard's bullish readings. |
| Bear Color | #FF1744 | Colour of everything bearish: SELL plates, the bearish cloud, the two lines when they point down, the stop line, the risk box and the dashboard's bearish readings. |
| Show Signals | On | Turns the signals off completely, not only their plates: no trade is tracked, no levels are drawn and the dashboard stays on WAITING. |
| SuperTrend Engine | ||
| Sensitivity (ATR Factor) | 3.10.1 or more | How far the SuperTrend bands sit from price, in ATRs. Higher flips less often, so signals are rarer. It is also the stop distance unless Use % SL is on. |
| Tuner (ATR Length) | 251 or more | The ATR length behind the SuperTrend bands, the stop and the trailing stop. |
| Signal Filtering | ||
| Preset | All Signals | The lowest star count a flip needs to become a signal: All Signals 0, Trend Scalper 2, Quality+ 3, Strong+ 4. |
| Min Strength (0-5) | 00 to 5 | A second minimum star count. The higher of this and the preset applies, so raising either can only make signals rarer. |
| Trending Only (ADX>20) | Off | Skips a signal unless ADX(14) is above 20. |
| Strong Only | Off | Skips a signal unless it has 4 or 5 stars. Strong Only Rule in the Compatibility group offers a second definition. |
| High Vol Only | Off | Skips a signal unless the bar's volume is above its 20-bar average. On forex this is MetaTrader's tick volume. |
| Cloud-Aligned Only | Off | Skips a signal unless the cloud points the same way: bullish cloud for a BUY, bearish for a SELL. Works with the cloud hidden too. |
| Contrarian Only | Off | Skips a signal unless the smoothed contrarian RSI is stretched the other way: below Oversold for a BUY, above Overbought for a SELL. |
| Pullback | ||
| Show Pullback Signals | Off | Adds small PB markers inside an existing trend, where a WaveTrend oscillator turns back up from below -40 (uptrend) or down from above 40 (downtrend). They are markers only, not signals. |
| Pullback Tuner | 51 or more | The WaveTrend length behind the PB markers. |
| Contrarian RSI | ||
| Contrarian Length | 505 or more | The RSI length behind the contrarian filter. |
| Smoothing | 301 or more | The smoothing applied to that RSI. |
| Overbought | 6050 to 95 | The level a SELL needs the smoothed RSI above when Contrarian Only is on. |
| Oversold | 405 to 50 | The level a BUY needs the smoothed RSI below when Contrarian Only is on. |
| EMA Cloud | ||
| Show Cloud | On | Draws the cloud. It is calculated either way, so Cloud-Aligned Only keeps working with it hidden. |
| Cloud Style | Smooth | Smooth is EMA 150 against EMA 250. Scalping is the SuperTrend line against price. Scalping+ is Hull 21 against Hull 55. Swing is EMA 50 against EMA 200. |
| Trend Tracer | ||
| Show Tracer | On | Draws the Trend Tracer, a long EMA coloured by whether price closes above or below it. |
| Tracer Length | 25010 or more | The Trend Tracer's EMA length. |
| TP / SL | ||
| Show TP/SL Area | On | Draws the entry, stop and target lines with their price tags and the risk and reward boxes. The levels are calculated either way and stay on the dashboard. |
| Show Trailing Stop | Off | Draws an orange trailing stop behind an open trade, one ATR-times-Sensitivity step behind price that only moves in the trade's favour. A drawn reference only; the indicator places no orders. |
| Use % SL | Off | Sizes the stop as a percentage of the entry price instead of ATR times Sensitivity. |
| % SL | 1.00.1 or more | That percentage. |
| TP1 (RR) | 1.00.1 or more | The first target as a multiple of the risk. 1.0 is one times the stop distance. |
| TP2 (RR) | 2.00.1 or more | The second target as a multiple of the risk. |
| TP3 (RR) | 3.00.1 or more | The third target as a multiple of the risk. Reaching it, or the stop, ends the tracked trade. |
| Market Structure | ||
| Show Swings | Off | Prints HH, HL, LH and LL at confirmed swing highs and lows. A swing is confirmed Swing Period bars after it forms. |
| Swing Period | 103 or more | Bars either side of a swing point. Larger means fewer and bigger swings. |
| Dashboard | ||
| Show Dashboard | On | Shows the 14-row dashboard panel. Hiding it changes nothing that is calculated. |
| Dash Position | Top Right | Which corner the dashboard sits in. |
| Dash Size | Small | Dashboard text size: Tiny, Small or Normal. |
| Watermark | ||
| Show Watermark | On | The large faint product name at the bottom of the chart. |
| Alerts | ||
| Enable Alerts | On | The master switch. Off silences every alert event below. |
| Webhook JSON Format | Off | Writes the BUY and SELL alert as one JSON object with the same fields, for tools that read JSON. The indicator sends nothing anywhere by itself. |
| MetaTrader | ||
| Candle Coloring | Momentum | How the candles are painted. Momentum (default) shades six colours by the MACD histogram against ATR. Trend uses Bull Color and Bear Color by the SuperTrend direction. Confluence shades from grey to the trend colour by the star count. Off leaves the candles to MetaTrader or another indicator. |
| Signal Marker Style | Label | Label draws the three-line plate (side, price, stars). Triangle, Arrow and Dot draw one small coloured symbol instead, for a busy chart. Signals, levels and alerts are the same in every style. |
| Signal Label Size | Auto | Auto sizes each plate by its stars: 4 or 5 large, 3 medium, 0 to 2 small. Tiny, Small and Normal fix one size for all. |
| Signal Label Transparency (0-100) | 00 to 100 | Transparency of the signal plates: 0 is solid (default), 100 is invisible. |
| Signal Label Offset (ATR) | 0.00 or more | Moves each plate away from its candle by this many ATRs. 0 hangs it on the bar's own low (BUY) or high (SELL). |
| Label Cap (oldest removed first) | 5001 or more | How many signal, PB, swing and price-tag labels stay on the chart. When the cap is reached the oldest goes first. |
| Bars to calculate (0 = all) | 200000 or more | How many recent bars are calculated. 0 means the whole history. Earlier bars are left empty, which keeps loading fast. |
| Server time zone (session row) | Auto | Used only for the Session row. Auto reads your broker's clock; pick a fixed offset only if your broker's server time is unusual. |
| Compatibility | ||
| Use TP1 | On | Tracks and draws the first target. |
| Use TP2 | On | Tracks and draws the second target. |
| Use TP3 | On | Tracks and draws the third target. Off means only the stop ends a tracked trade. |
| Strong Only Rule | Score of 4 or more | What Strong Only tests. Score of 4 or more is the default. Close beyond EMA 200 instead asks for a close above EMA 200 for a BUY and below it for a SELL. |
| Alert Events | ||
| Alert: Buy Signal | On | A BUY signal, with price, star rating, stop and the three targets in the message. |
| Alert: Sell Signal | On | A SELL signal, with the same fields. |
| Alert: Any Signal | Off | Either signal, as one short line. Off by default because Buy and Sell already cover it. |
| Alert: Strong Signal | Off | A signal with 4 or 5 stars, as one short line. Off by default. |
| Alert: SL Hit | On | Price reaching the stop of the tracked trade, once. |
| Alert: TP1 Hit | On | Price reaching the first target, once. |
| Alert: TP2 Hit | On | Price reaching the second target, once. |
| Alert: TP3 Hit | On | Price reaching the third target, once. |
| Alert: Trend Change | On | The SuperTrend flipping, whether or not a signal passed the filters. |
| Alert Channels | ||
| Popup window | On | MetaTrader's alert window, with its own sound. |
| Sound | Off | Plays the sound file below on each alert. |
| Sound file (in the terminal's Sounds folder) | alert.wav | A .wav file in the terminal's Sounds folder. |
| Push notification | Off | Push notification to the MetaTrader app on your phone (set up under Tools, Options, Notifications). |
| Off | E-mail through the terminal's own mail settings (Tools, Options, Email). | |
Nine events, four ways to hear about them
Every alert is decided on a closed bar, fires once per event for that bar, and never fires for the history the indicator calculates when it loads or in the Strategy Tester. BUY and SELL carry the whole plan in one line; the stop, target and trend alerts name the event, the symbol and the timeframe. Filled with the newest signal on the EURUSD H1 chart above:
- SELL | EURUSD.i | H1 | Price: 1.13263 | Moderate (3/5) | SL: 1.13618 | TP1: 1.12908 | TP2: 1.12554 | TP3: 1.12199
- TP1 HIT | EURUSD.i | H1 | Entry: 1.13263
- TREND CHANGE to BULLISH | EURUSD.i | H1
Switch on Webhook JSON Format and the BUY and SELL alerts arrive as one JSON object with the same fields, for tools that read JSON; the indicator itself sends nothing anywhere:
- {"indicator":"HyperTrend PRO","symbol":"EURUSD.i","tf":"H1","signal":"SELL","price":1.13263,"score":"3/5","sl":1.13618,"tp1":1.12908,"tp2":1.12554,"tp3":1.12199}
Each event can reach you as a MetaTrader popup, a sound of your choice, a push notification to the MetaTrader app on your phone or an e-mail, with one switch per channel and one master switch.
- Buy Signal on by default
- Sell Signal on by default
- Any Signal off by default
- Strong Signal off by default
- SL Hit on by default
- TP1 Hit on by default
- TP2 Hit on by default
- TP3 Hit on by default
- Trend Change on by default
Two builds, two manuals, nothing left to configure
- 2Indicator builds, version 4.00Hyper_Trend_PRO.ex4 for MetaTrader 4 and Hyper_Trend_PRO.ex5 for MetaTrader 5, in one 3.1 MB download.
- 2PDF manualsOne per platform, 23 pages each: install, how a signal is made, the stars, the presets and filters, the levels, every dashboard row, every input, alerts and troubleshooting.
- 4PresetsAll Signals (0+ stars), Trend Scalper (2+ stars), Quality+ (3+ stars), Strong+ (4+ stars).
- 63InputsEvery one explained, with the original design's defaults.
- 9Alert eventsBy popup, sound, push or e-mail, on closed bars only.
- 60Day money-back guaranteeIf it is not for you, e-mail within 60 days of purchase for a full refund.

Dominic Walsh
Founder, forexobroker.com
I have traded forex since 2014 and started writing about it the same year. forexobroker.com now reaches over 40,000 readers a month, and every indicator, Expert Advisor and tutorial on it is something I have built, tested or used in my own trading.
Hyper Trend PRO is the trend tool I reach for when I want the whole picture in one place: the direction, how much agrees with it, and where I am wrong, drawn before I place anything. The charts on this page were captured from the shipped build at its default settings and are shown unedited.
No get-rich claims and no win rates. Trading is a probability business. If you want to know whether it suits the way you trade before you buy, e-mail me at [email protected] and I will tell you straight.
One price, both platforms
- Both builds: .ex4 for MetaTrader 4 and .ex5 for MetaTrader 5
- Two PDF manuals, one per platform
- Star-rated signals with entry, stop and three targets, 63 inputs, 9 alert events
- Instant download and a 60-day money-back guarantee
60-day money-back guarantee. Install it, run it on your own markets and read the manual. If Hyper Trend PRO is not for you within 60 days of purchase, e-mail [email protected] for a full refund, no questions asked. Files are delivered instantly on a secure download page after checkout. This is a software tool, not financial advice.
Answered straight
The things people actually e-mail about before buying. If yours is not here, ask before you buy at [email protected].
How it works
Does it repaint?
No. A signal, its stars, its levels and every alert are decided on a closed bar, so a plate that has printed stays where it is. It appears once its bar is complete, which in practice is when the next bar opens. What does move is the SuperTrend line, the cloud, the candle colour and the dashboard on the bar that is still forming, because they follow the live price until that bar closes.
What exactly triggers a BUY or a SELL?
A BUY needs the SuperTrend to flip up on a closed bar, a SELL needs it to flip down. With the default All Signals preset and every filter off, every flip is a signal. A preset or Min Strength raises the number of stars a flip needs, and each filter you switch on (Trending Only, Strong Only, High Vol Only, Cloud-Aligned Only, Contrarian Only) must also agree. Nothing else creates a signal.
What do the stars mean?
One star for each of five checks that agree with the flip at that bar. MACD histogram (12, 26, 9): rising against the previous bar for a BUY, falling for a SELL; EMA 150 against EMA 250: 150 above 250 for a BUY, 150 below 250 for a SELL; ADX (14): above 20 for a BUY, above 20 for a SELL; Volume against its 20-bar average: above it for a BUY, above it for a SELL; Hull moving average (55): rising for a BUY, falling for a SELL. ADX and volume are not directional, so they count for both sides. The alert names the rating too: Strong at 4 or 5 stars, Moderate at 3, Weak below.
Which preset should I use?
All Signals needs 0 stars or more; Trend Scalper needs 2 stars or more; Quality+ needs 3 stars or more; Strong+ needs 4 stars or more. On the 20 MetaTrader 5 charts we measured, All Signals gave 17 to 30 signals per 1,000 bars; Trend Scalper gave 17 to 30 signals per 1,000 bars; Quality+ gave 15 to 29 signals per 1,000 bars; Strong+ gave 8 to 18 signals per 1,000 bars. Start with All Signals to see every flip and its stars, then raise the preset when you know which ratings you want to act on.
How are the stop and the targets set?
The signal bar's close is the entry. The risk is the 25-bar ATR times Sensitivity (3.1 by default), or a percentage of the entry if you switch on Use % SL. The stop sits one risk away and the targets at 1.0, 2.0 and 3.0 times the risk. A target is ticked when price trades through it; the stop or the third target ends the tracked trade, and the dashboard keeps its prices until the next signal.
What are the cloud and the Trend Tracer?
The cloud is EMA 150 against EMA 250 by default (Cloud Style also offers a SuperTrend, a Hull and an EMA 50/200 cloud); Cloud-Aligned Only can require a signal to agree with it. The Trend Tracer is a 250-period EMA coloured by whether price closes above or below it. Both give context; neither creates a signal.
What are the PB and HH/HL labels?
Two optional layers, off by default. Show Pullback Signals marks re-entry points inside an existing trend, where a WaveTrend oscillator turns back from an extreme. Show Swings prints HH, HL, LH and LL at confirmed swing points. Both are markers only: they do not open a tracked trade or raise a signal alert.
The proof
Are the charts on this page real?
Yes. Each one was saved by MetaTrader itself on the Blueberry Markets Pty Ltd demo server on 8 October 2026, with the shipped indicator attached at its default inputs, and none was edited. The MetaTrader 5 charts show the history stored in that terminal, up to 1 Oct 2026; the MetaTrader 4 charts were live. The dashboard values and signal counts printed next to them were computed from the same charts' bars at the same moment, by the same engine.
What is the win rate?
This page does not print one, on purpose. A win rate depends on the market, the timeframe, the period, the preset and on how you manage the trade, so any single number would flatter some charts and hide others. The frequency table tells you how often it fires and the charts show signals that reached their targets and signals that hit the stop. Test it on a demo account on your own markets before you trade it.
How do I know the MetaTrader version calculates what it should?
Every value the engine computes was compared with the original design's own output, bar by bar, on both builds: 15,991,469 values per platform, with no differences, and the plates, levels and dashboard text were compared the same way. On the charts on this page, the signal count each chart drew was also recomputed independently and matched on all 30 charts.
Does it work on gold, indices and crypto?
Yes. It reads price and volume only, so it runs on any symbol your broker quotes. We captured it on 17 markets across forex, gold, silver, stock indices, oil and crypto, from M15 to H4. On most MetaTrader symbols the volume is tick volume, which is what the volume check uses.
Using it
MetaTrader 4 or 5: which should I use?
Whichever your broker offers; the signals, stars, levels and dashboard values are the same. MetaTrader 5 draws a filled cloud and colour candles natively; MetaTrader 4 draws them with histogram bars. Both builds are in the download.
Which timeframes work best?
M15 to H4 is where it is most at home, and every chart on this page was taken between M15 and H4. The timeframe row of the dashboard is fixed at M5, M15, M30, H1 and H4, so on a daily chart it looks at lower timeframes.
The plates cover my candles. Can I change them?
Yes, without changing a single signal. Signal Marker Style swaps the plate for a small triangle, arrow or dot; Signal Label Size fixes the size; Signal Label Transparency fades it; Signal Label Offset (ATR) moves it away from the candle. Label Cap (500 by default) limits how many labels stay on the chart.
Can I run it on several charts?
Yes. Each chart runs its own copy with its own dashboard, levels and alerts, and every alert names its symbol and timeframe. Attach it once per chart: two copies on the same chart draw over each other.
Will it trade for me?
No. It is an indicator, not an Expert Advisor: it rates, draws the trend and the levels, shows the dashboard and raises the alerts. You place and manage the orders, with whatever position size and risk your account allows.
What is the Server time zone input for?
Only the Session row of the dashboard. Auto reads your broker's clock, which works for almost every broker; pick a fixed offset if your broker's server time is unusual. It changes no signal.
After you buy
How do I get it after paying?
Checkout takes you straight to a private download page with one zip holding both builds and both manuals. Bookmark that page for re-downloads.
Do I get updates?
Yes. Free updates to the current version are posted on the same download page.
Do I get the source code?
No. The download holds the compiled .ex4 and .ex5 files and the two manuals.
What is the refund policy?
A 60-day money-back guarantee. If Hyper Trend PRO is not for you within 60 days of purchase, e-mail [email protected] for a full refund, no questions asked.
Know how much backs a signal, and where it is wrong, before you take it.
Both builds, two manuals and every input explained. Instant download for $47 at the launch price.
Get instant access