Range-break signals on closed bars, with the stop and targets already drawn.
Flux Gate Precision measures the high-low range of the last 44 bars and sets two Fibonacci gates inside it. A BUY or SELL arrow prints only when a bar closes through a gate, and that same close sets an ATR-sized stop and up to four targets. The dashboard tracks every level and eight alert events tell you when one is reached. One purchase includes both the .ex4 and the .ex5.
- Decided on closed bars. Once an arrow prints it does not move or disappear.
- Measured on 25 live MetaTrader 5 charts: 12 to 26 signals per 1,000 bars at the default gates.
- MetaTrader 4 and 5 builds and a PDF manual for each, one-time $47.
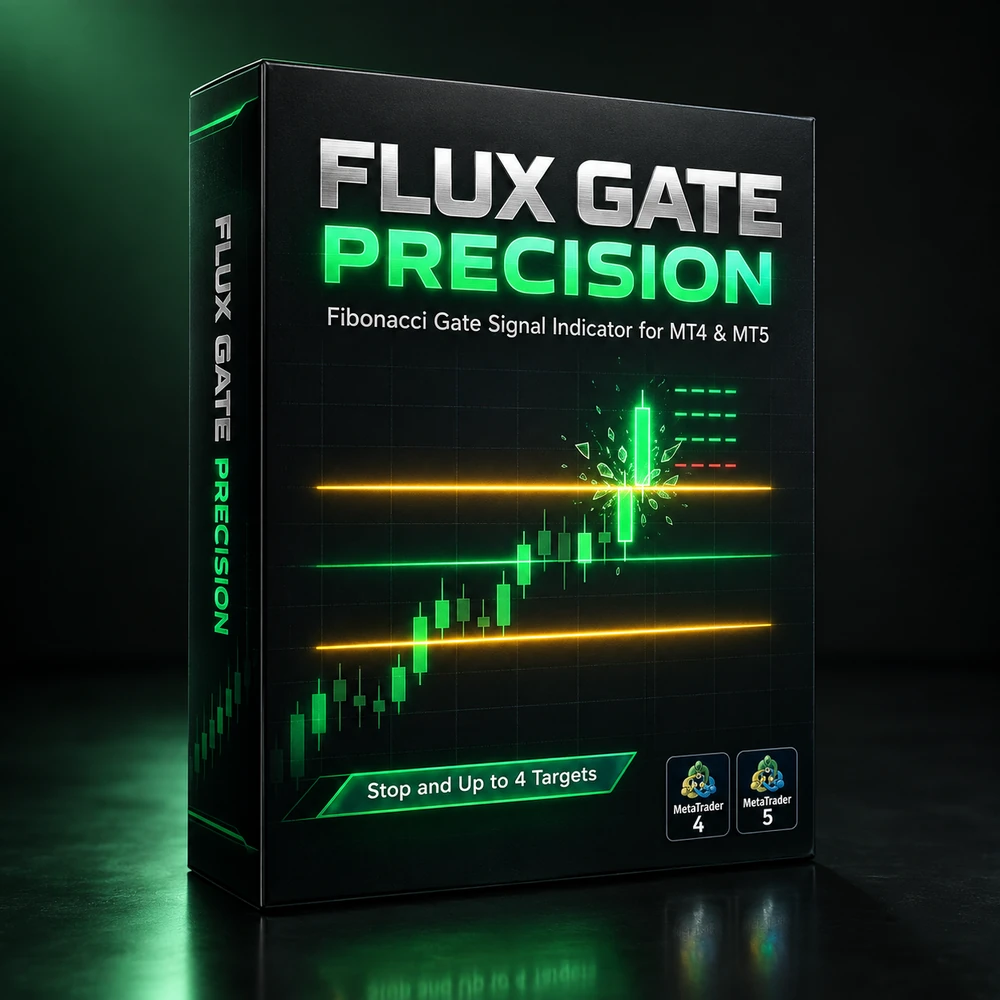
Schematic of the rule at the default inputs. The real charts are further down the page.
Measured on these markets
Runs on
 MetaTrader 4
 MetaTrader 5
An arrow is easy to draw. A plan you can check on every arrow is not.
Most buy and sell indicators fail in one of two ways. Either the arrow appears while the bar is still forming and quietly moves or vanishes when the bar closes, so the history looks better than anything you could have traded. Or the arrow is all you get: no stop, no target, and nothing to tell you how the last signal ended.
Flux Gate Precision is one plain rule with everything a trader needs around it. It waits for a bar to close beyond a Fibonacci gate inside the recent range, prints the arrow on that closed bar, and in the same moment draws the entry, an ATR-sized stop and up to four targets. From then on the dashboard and the alerts follow that trade until the stop, the break-even exit, the last target or the next signal ends it.
Read the charts, not the promise. Every chart on this page is a real MetaTrader capture of the shipped build at its default settings, and every number in the frequency table was counted on live charts captured the same day, the same way. Nothing is drawn in by hand. Click any chart to open it full size.
Signals per 1,000 bars, counted on 25 live charts
Arrows on the last 1,000 closed bars of each chart, at the default gates (23.6 and 78.6) and with both gates moved to the looser 38.2 and 61.8. It tells you how busy a chart will be, not how many signals win.
| Market | Chart | Default gates | Looser gates |
|---|---|---|---|
| EURUSD | H14 Aug to 1 Oct 2026 | ||
| GBPUSD | M302 Sep to 1 Oct 2026 | ||
| USDJPY | H14 Aug to 1 Oct 2026 | ||
| AUDUSD | H14 Aug to 1 Oct 2026 | ||
| USDCAD | M302 Sep to 1 Oct 2026 | ||
| Gold (XAUUSD) | H131 Jul to 1 Oct 2026 | ||
| Silver (XAGUSD) | H131 Jul to 1 Oct 2026 | ||
| Bitcoin (BTCUSD) | H120 Aug to 1 Oct 2026 | ||
| Ether (ETHUSD) | H417 Apr to 1 Oct 2026 | ||
| S&P 500 (SP500) | H131 Jul to 1 Oct 2026 | ||
| Nasdaq 100 (NAS100) | M301 Sep to 1 Oct 2026 | ||
| DAX 40 (GER40) | H131 Jul to 1 Oct 2026 | ||
| FTSE 100 (UK100) | H130 Jul to 1 Oct 2026 | ||
| WTI crude (USWTI) | H131 Jul to 1 Oct 2026 |
What this table admits: across all 25 MetaTrader 5 charts the default gates gave 12 to 26 signals per 1,000 bars, roughly one every 38 to 83 bars, and the looser gates gave 21 to 45, between 18 and 138 percent more depending on the market. The rate per bar barely depends on the timeframe: EURUSD gave 20 on M15 and 17 on H1, gold 20, 21 and 22 on M30, H1 and H4. A count says nothing about how many signals reached a target; the charts below show signals that did and signals that were stopped.
19 real MetaTrader charts at default settings
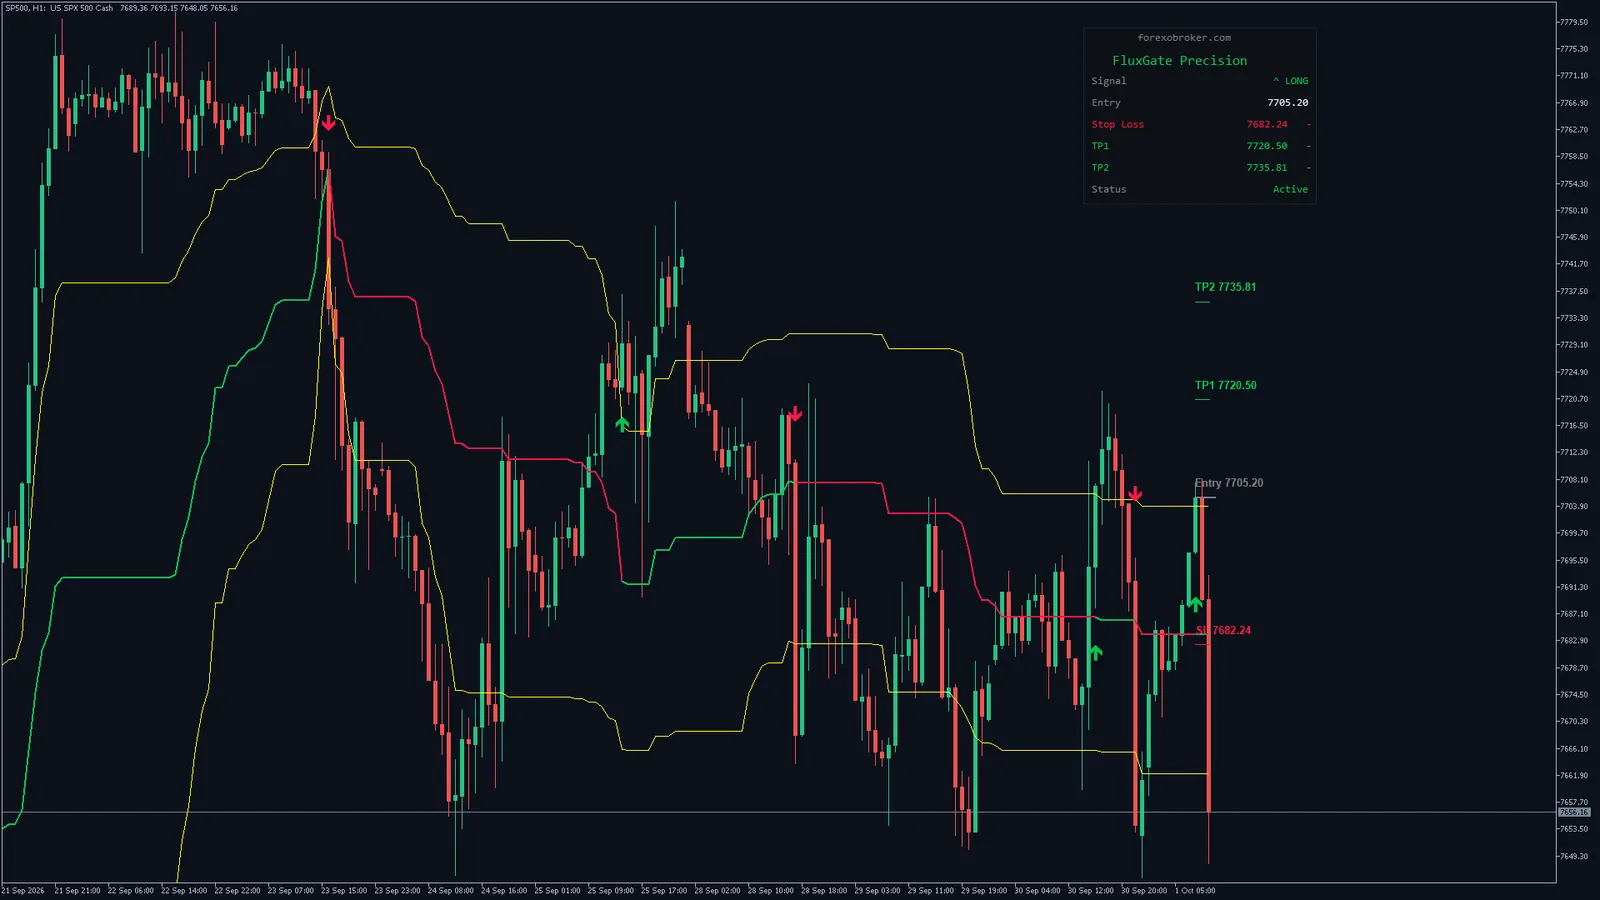
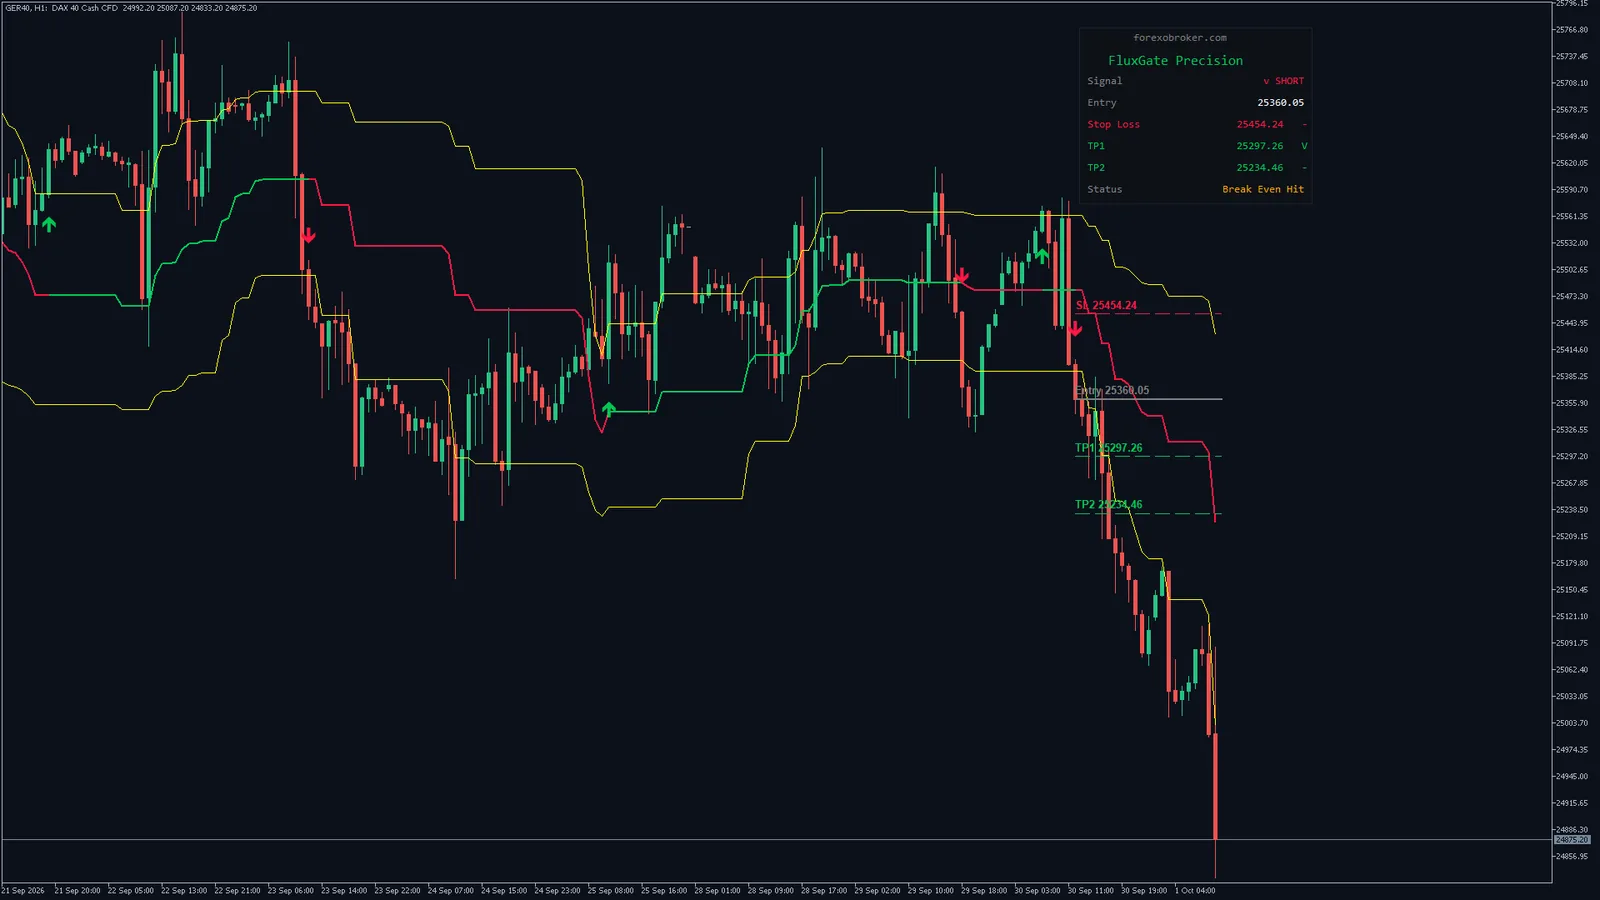
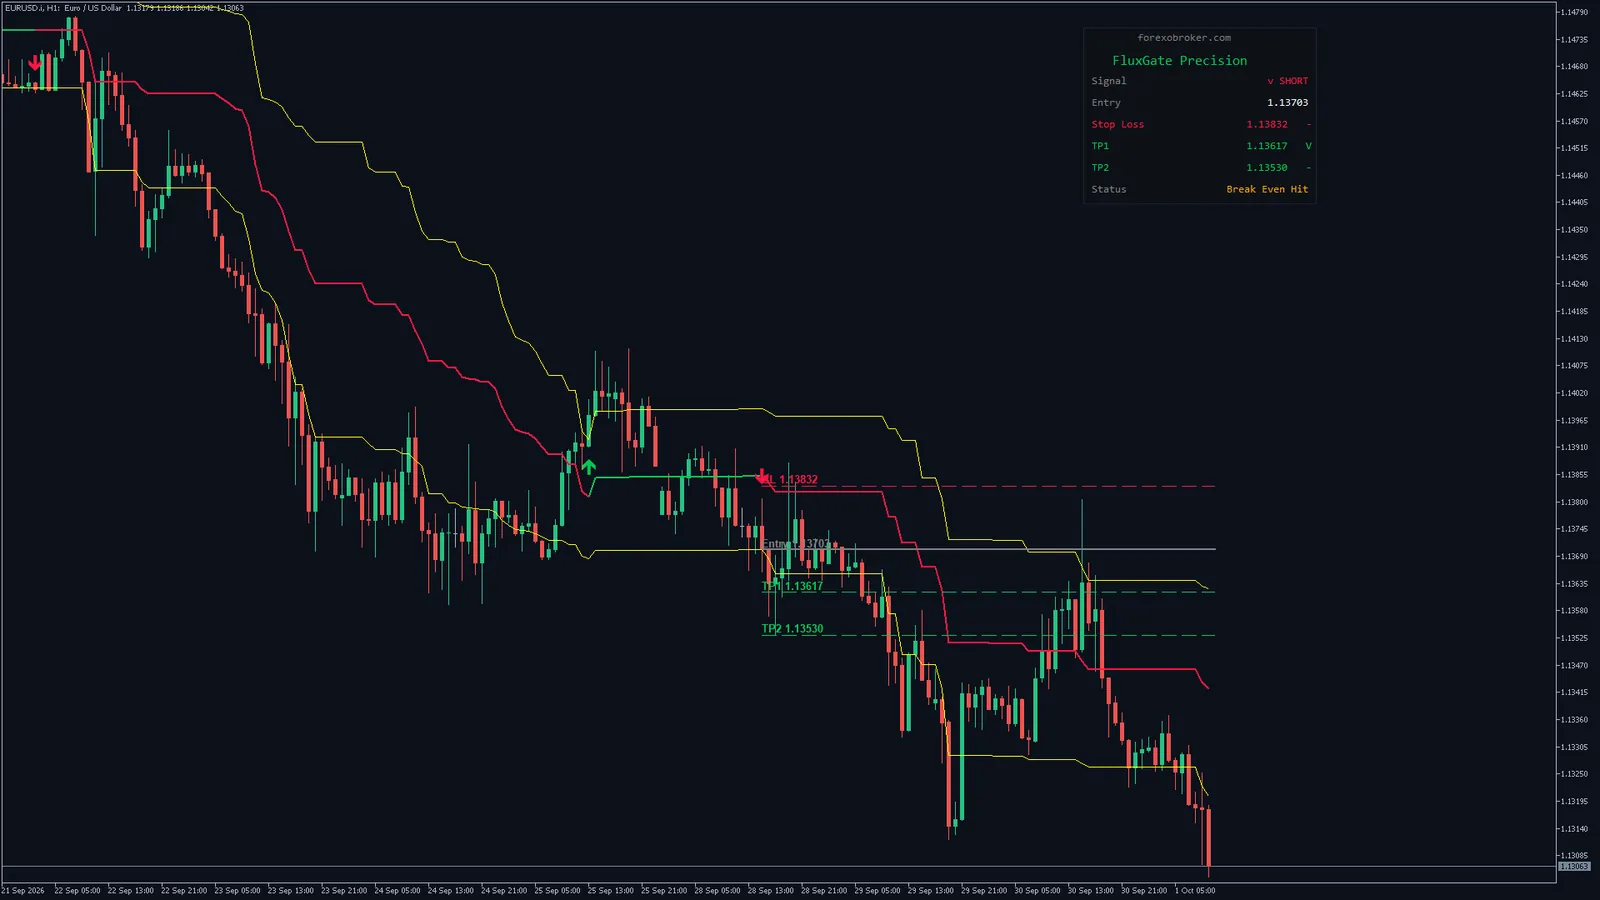
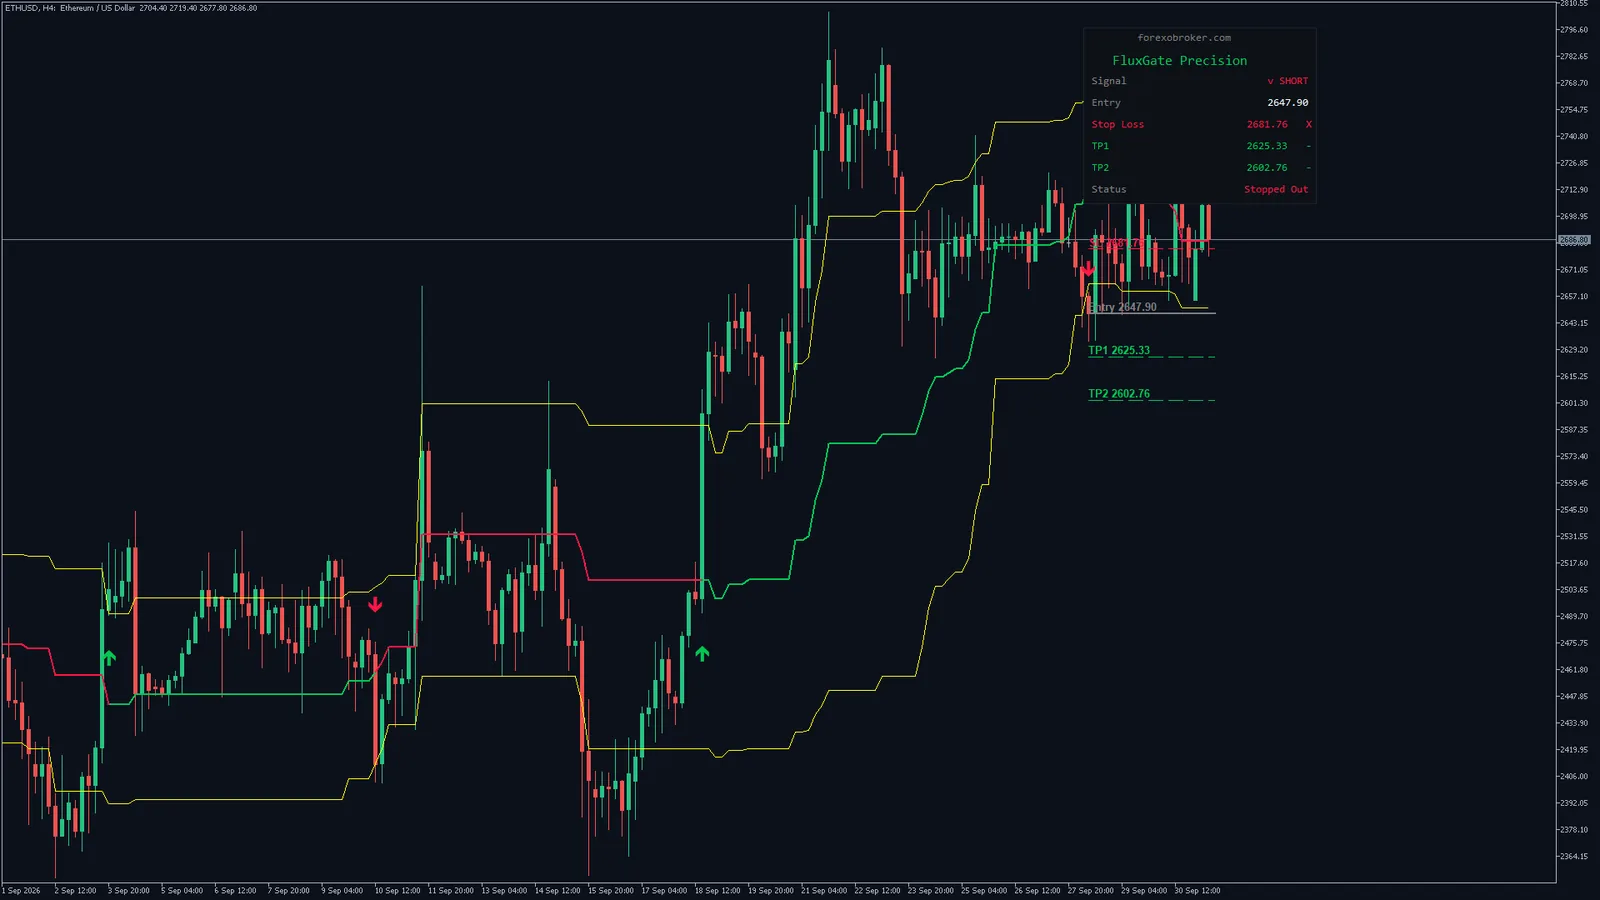
Each one was saved by MetaTrader itself from a live chart of the shipped build, with the indicator attached exactly as you would attach it: arrows, gate lines, the latest trade's levels and the dashboard. Click any chart to open it full size.
Page updated 2 October 2026 · charts captured 1 October 2026 on the Blueberry Markets Pty Ltd demo feed · MetaTrader 5 build 6230, MetaTrader 4 build 1479 · default inputs
MetaTrader 5 chartGold M30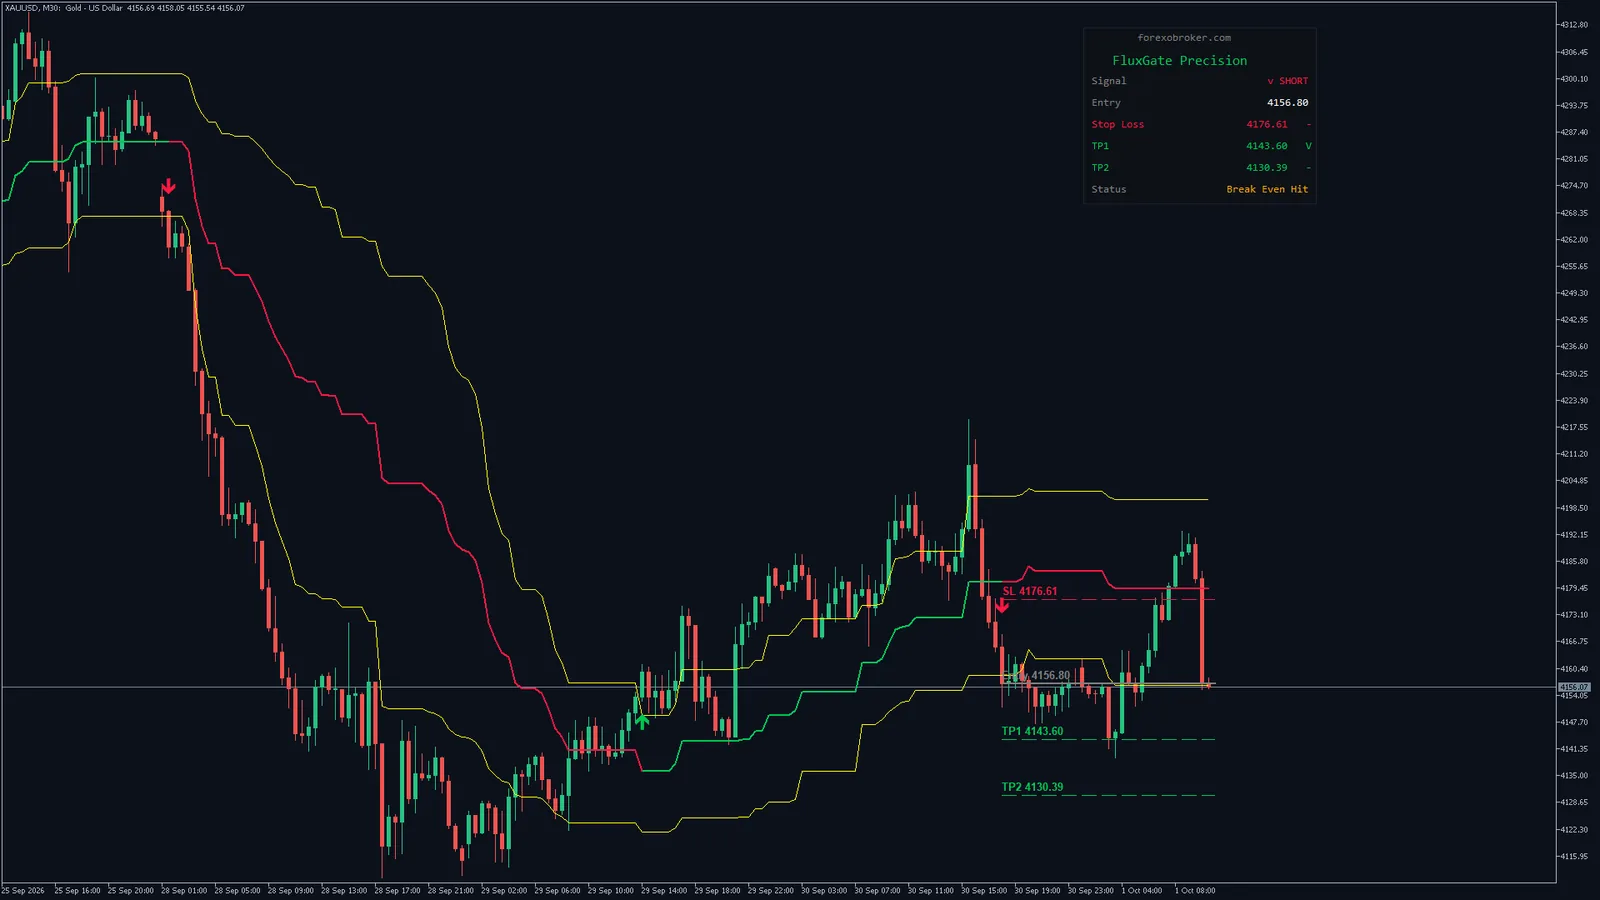 MetaTrader 5 chartS&P 500 H1
 MetaTrader 5 chartDAX 40 H1
 MetaTrader 5 chartEURUSD H1
 MetaTrader 5 chartEther H4
 MetaTrader 4 chartGold M30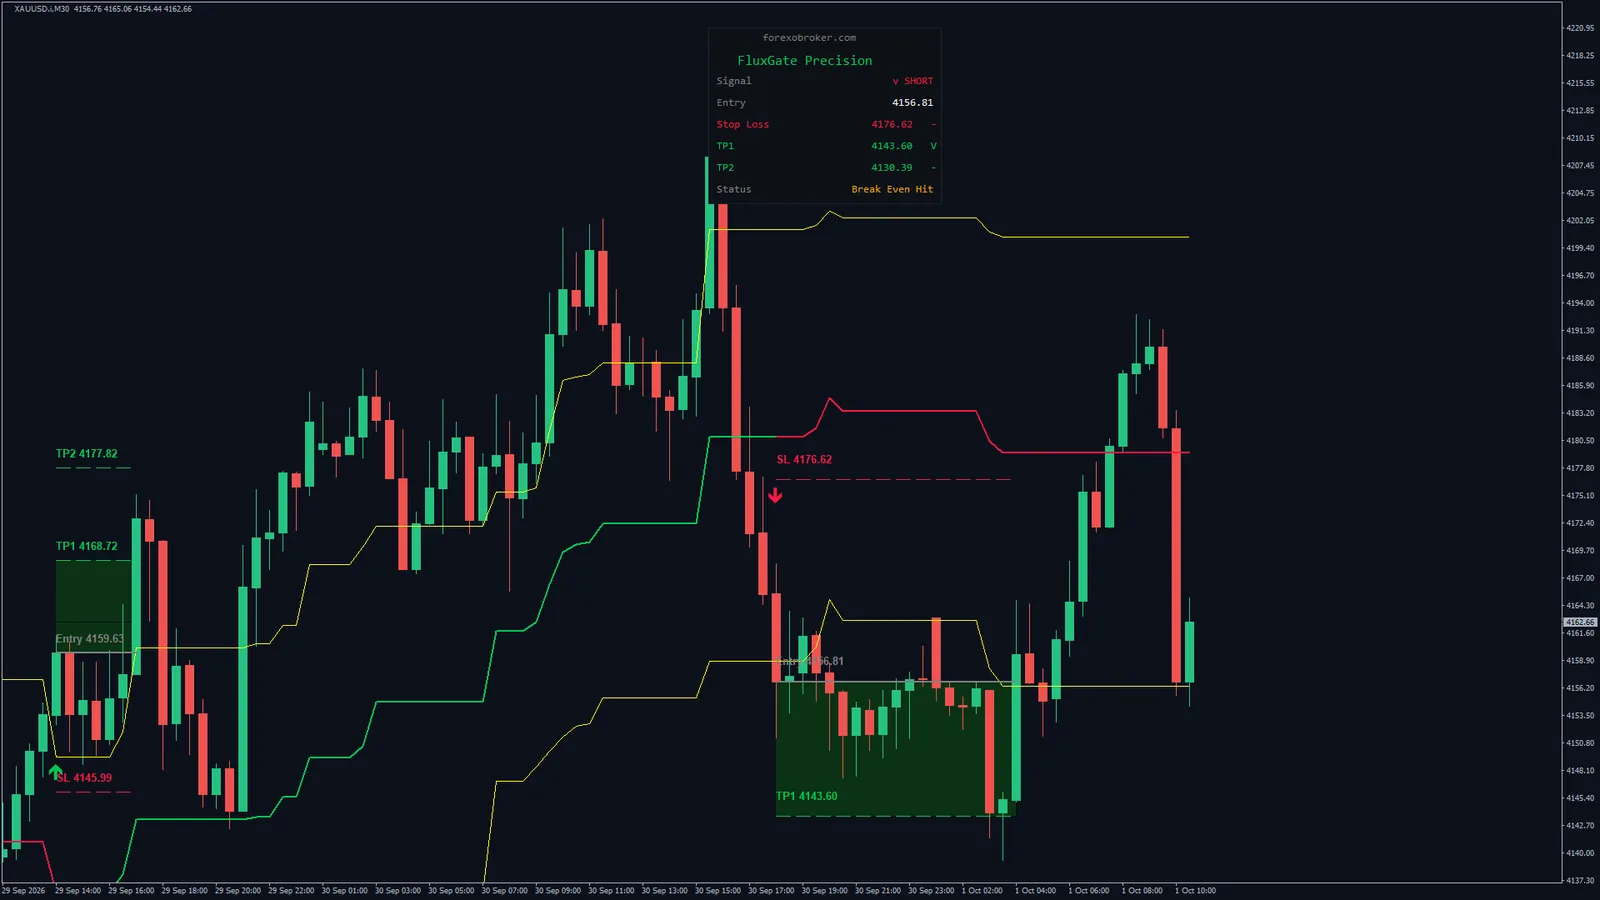
Every chart we captured, by market
Forex6 charts
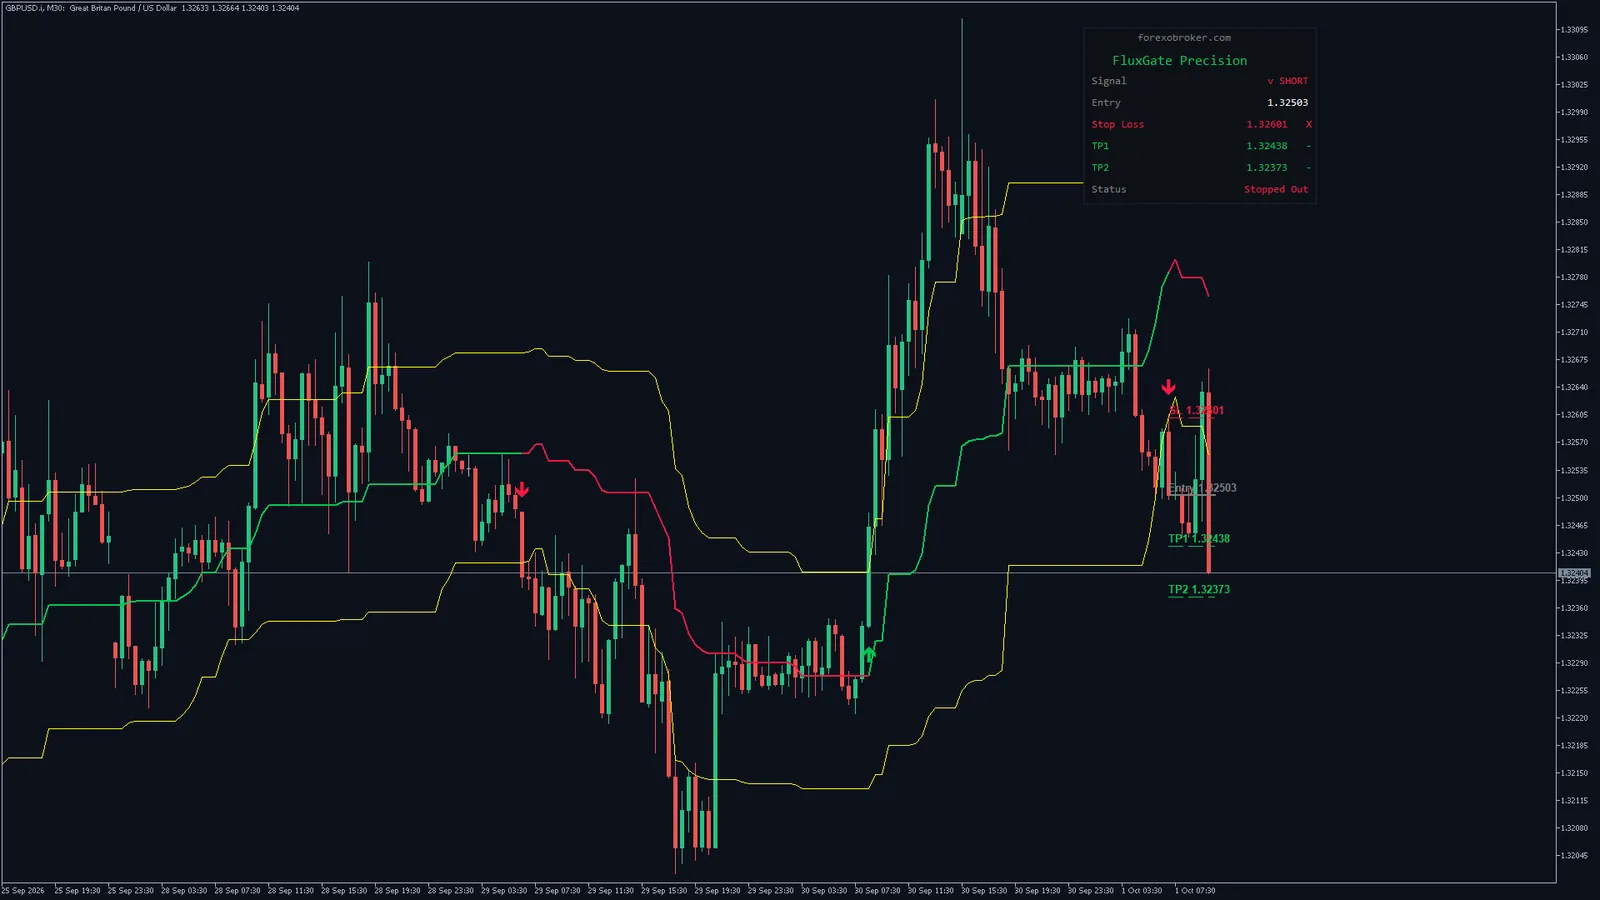
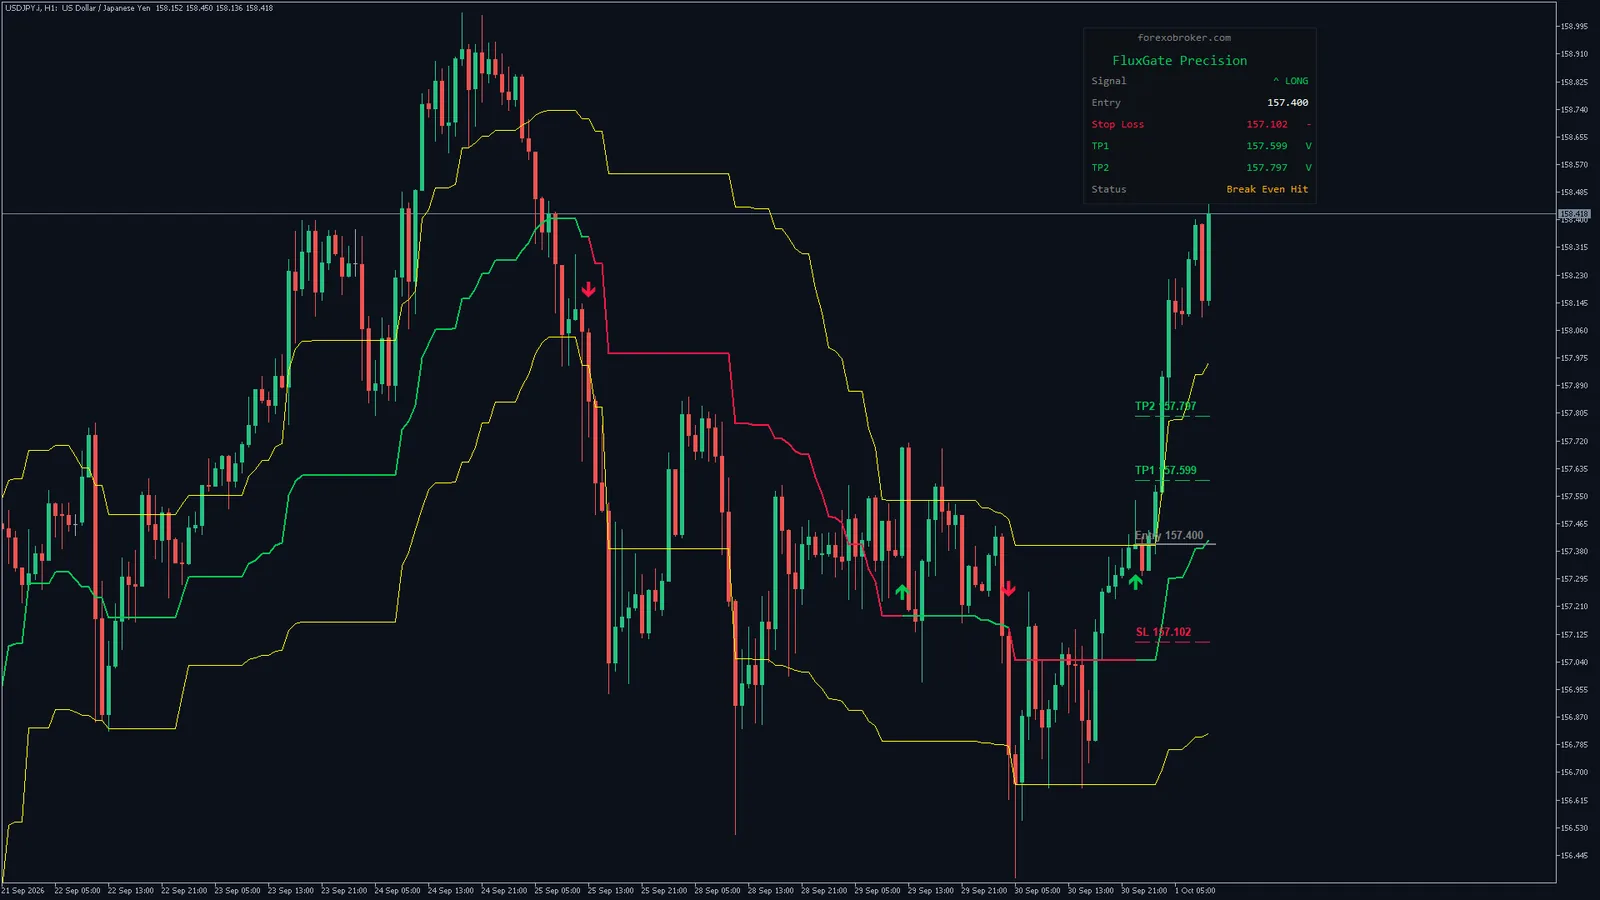
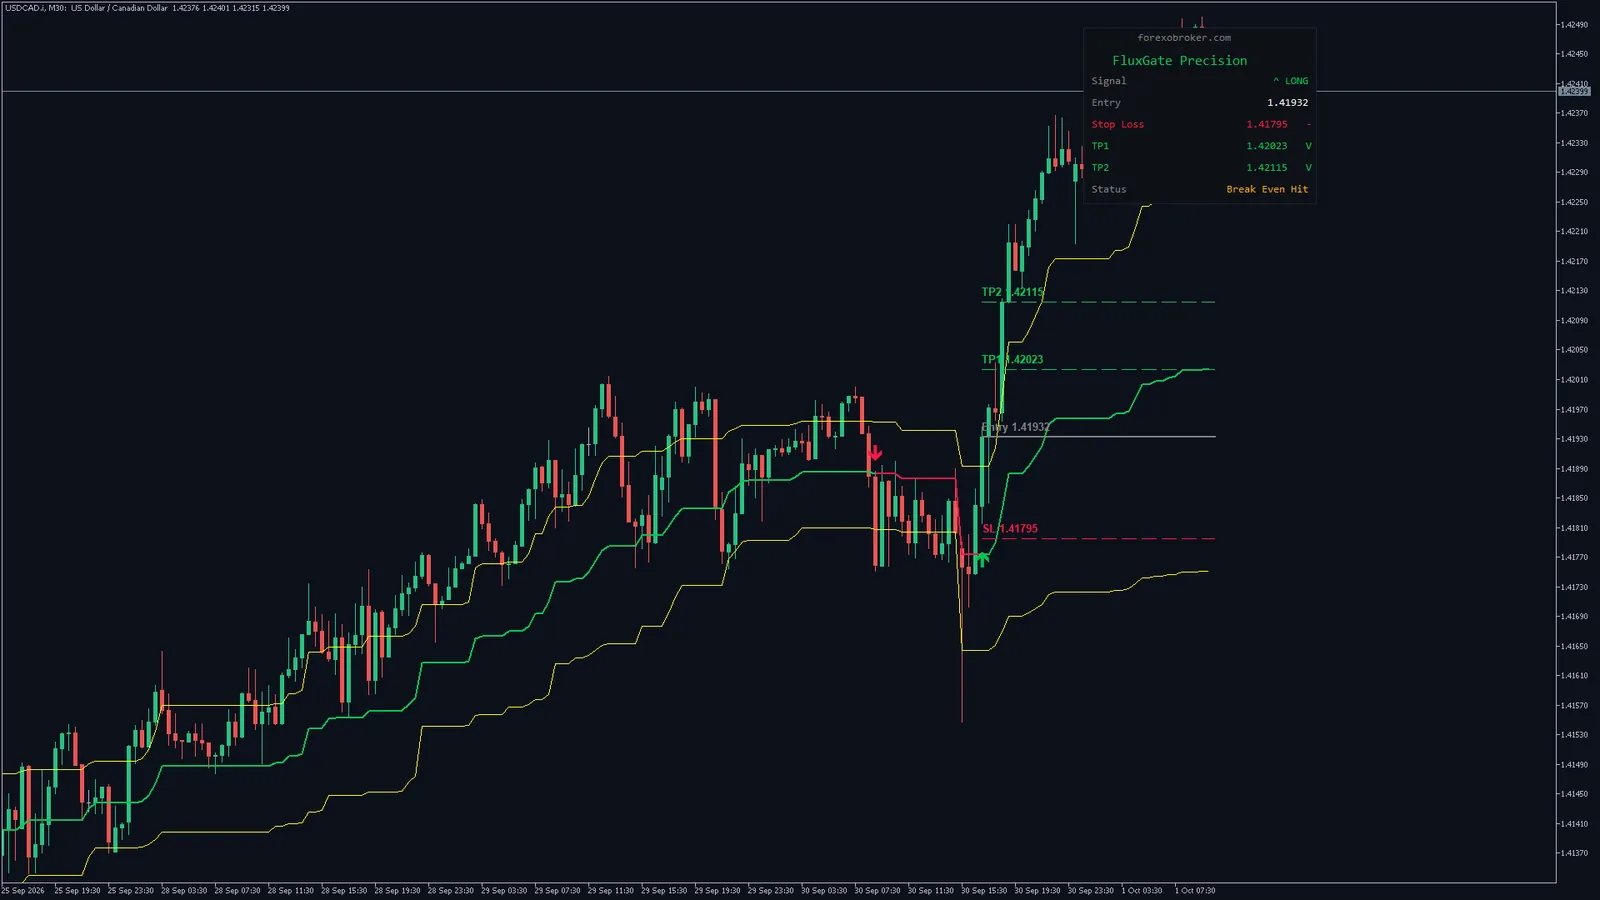
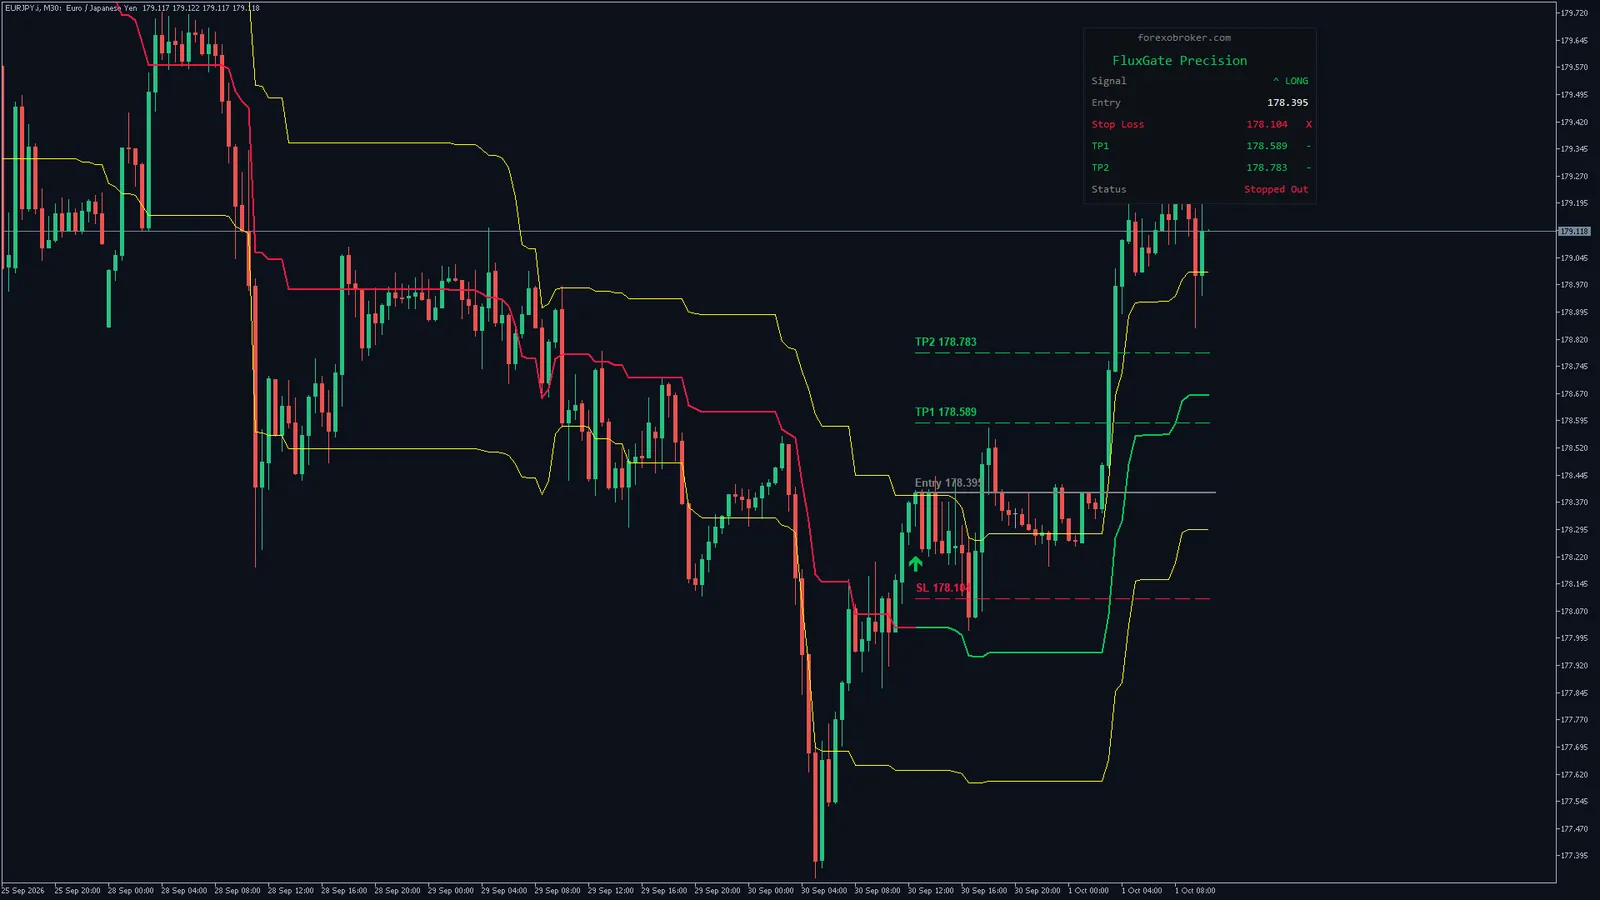
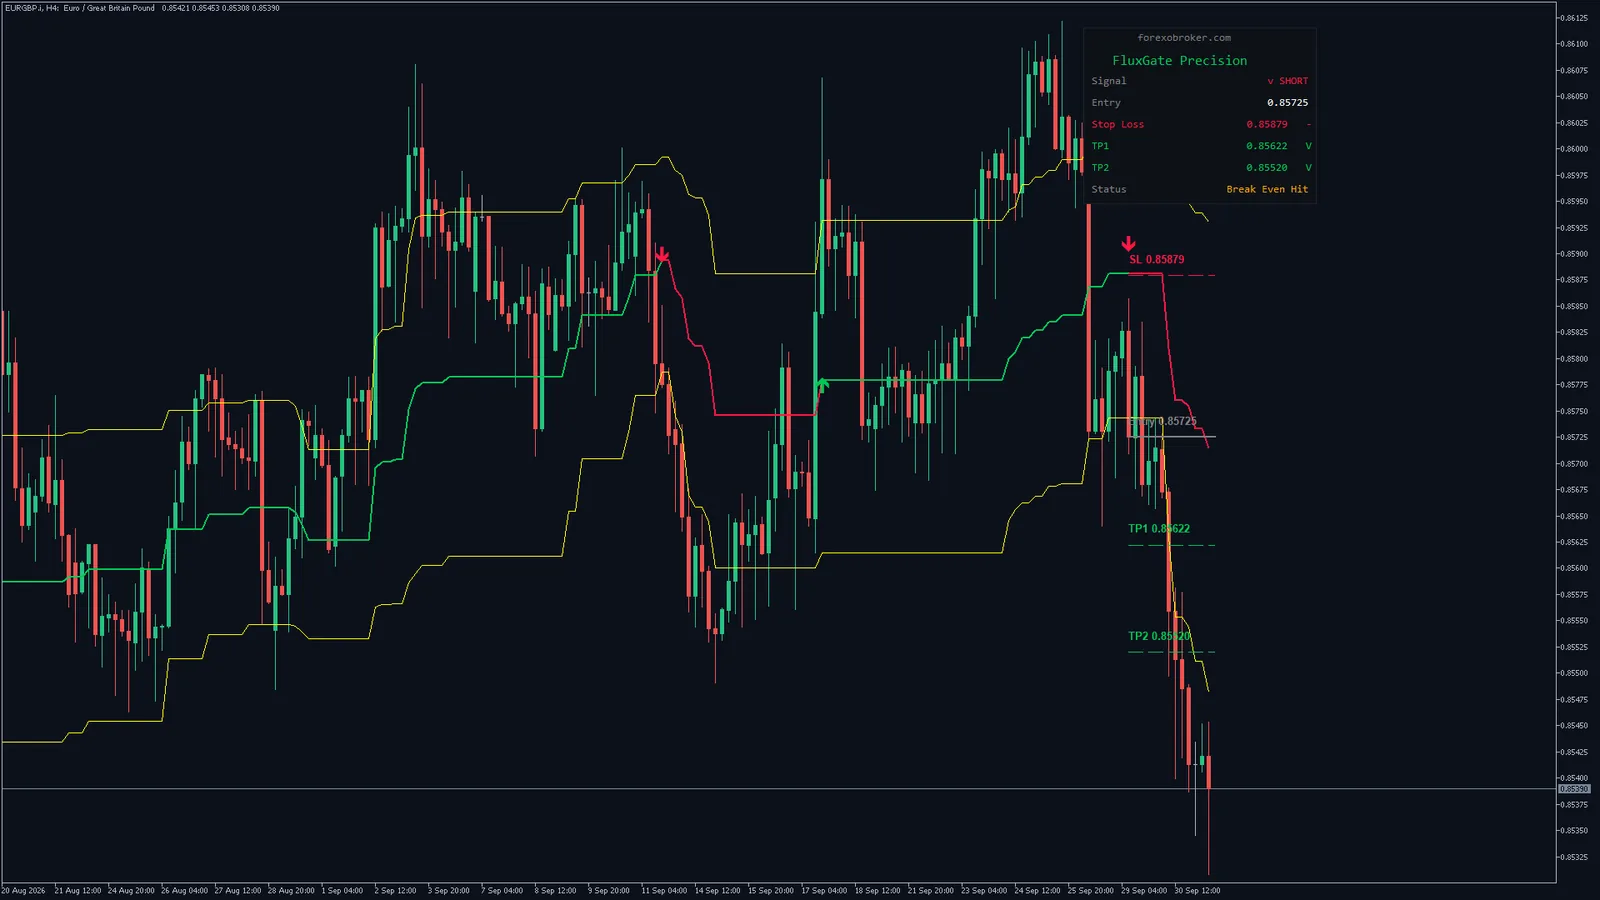
Metals and crypto5 charts
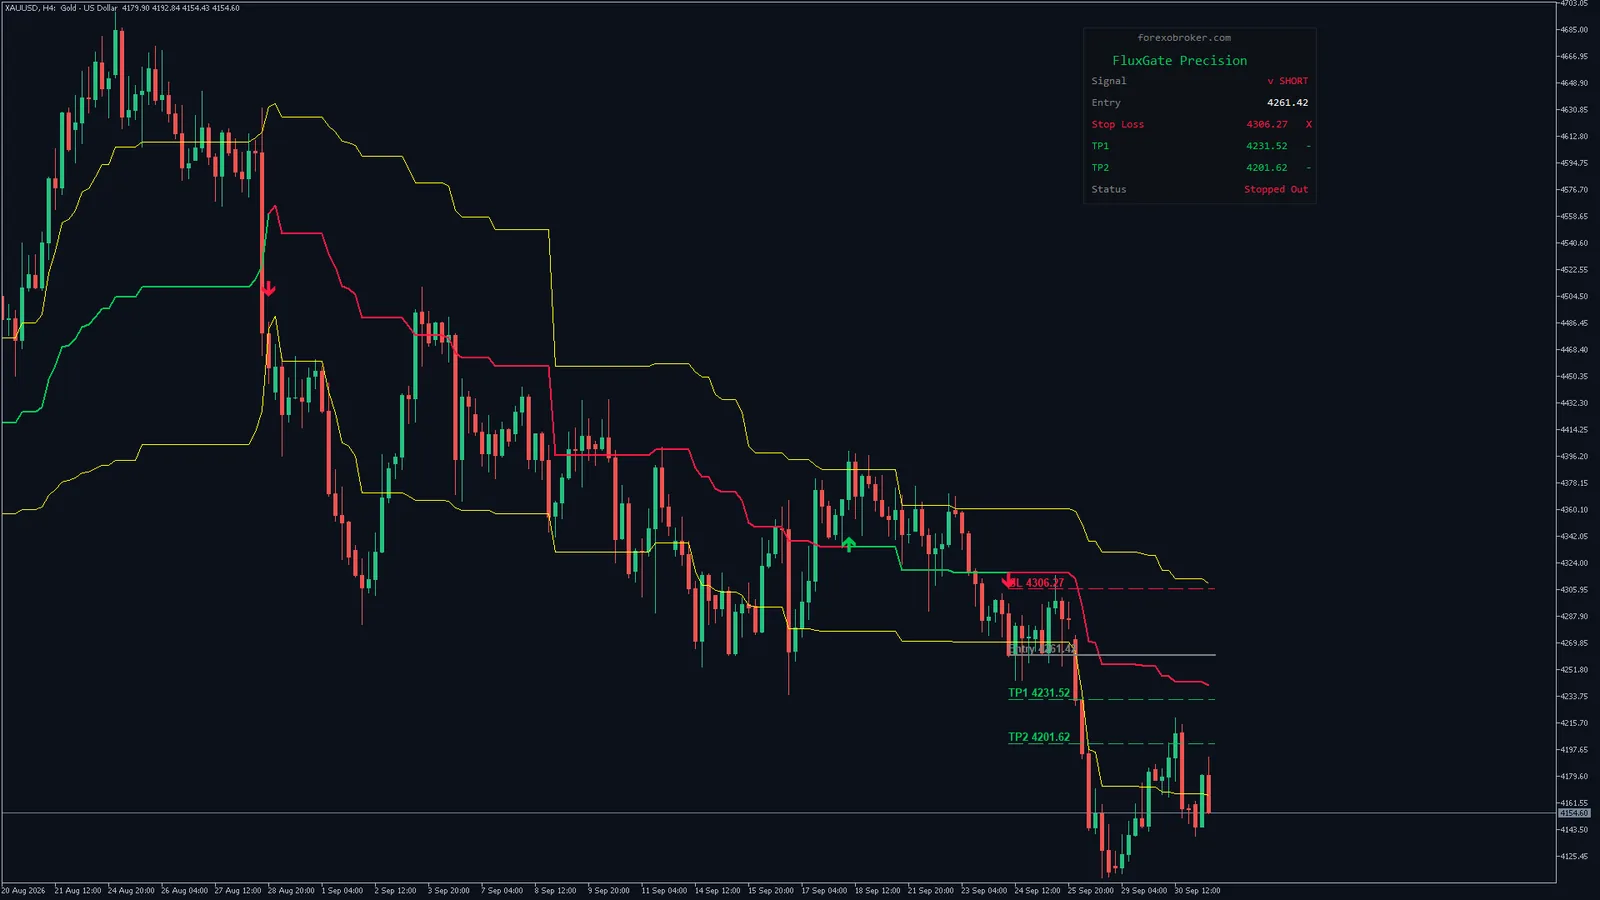
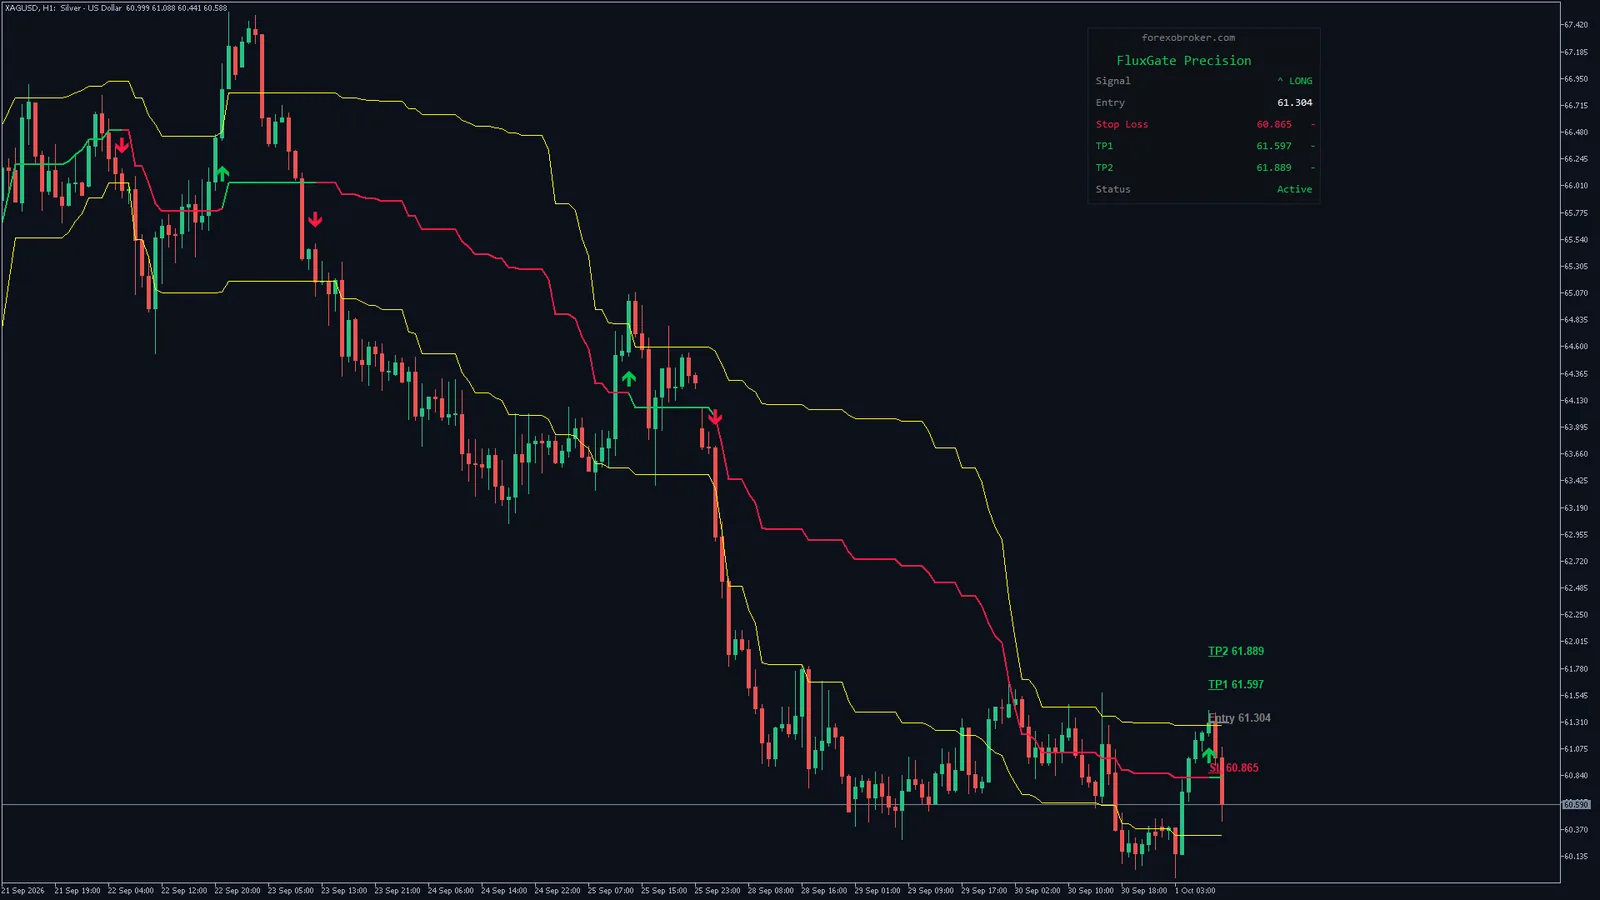
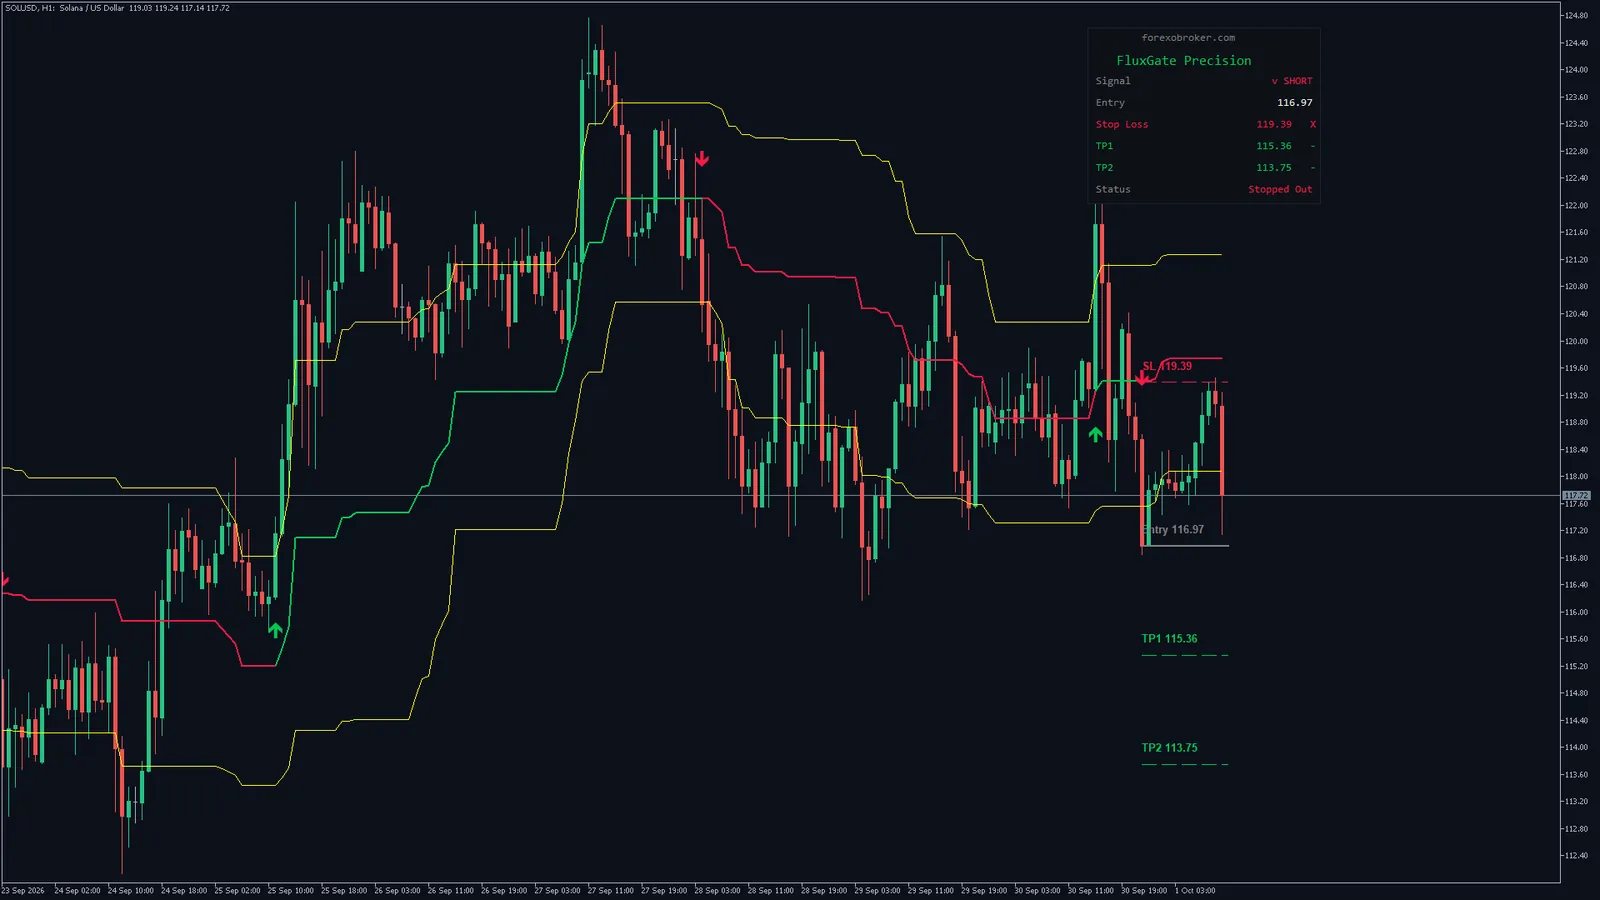
Indices and oil5 charts
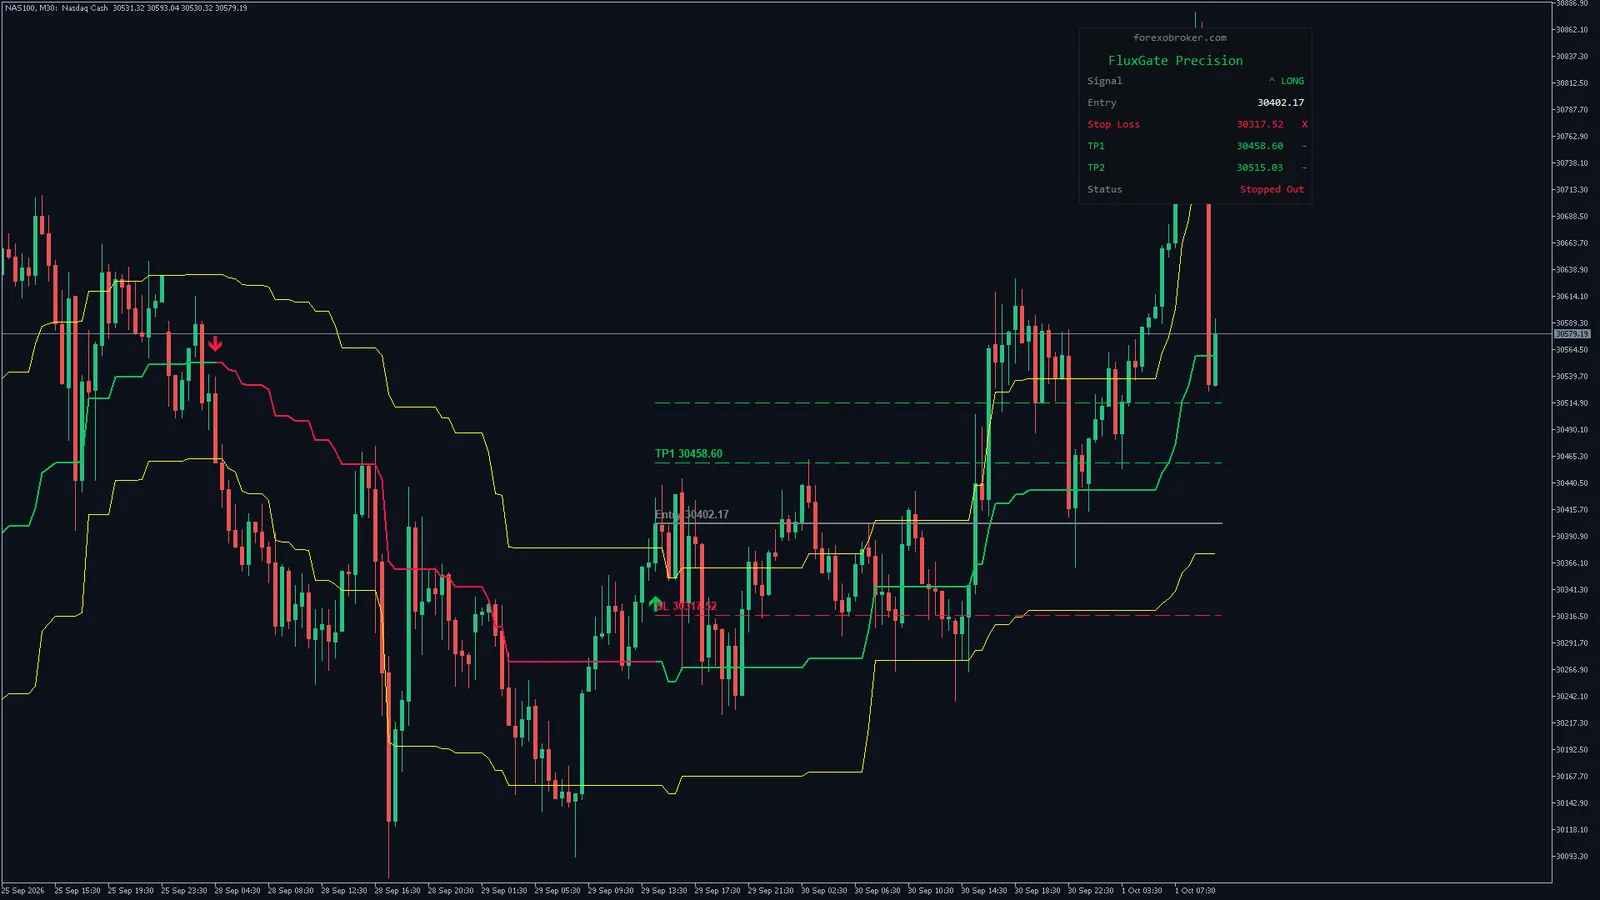
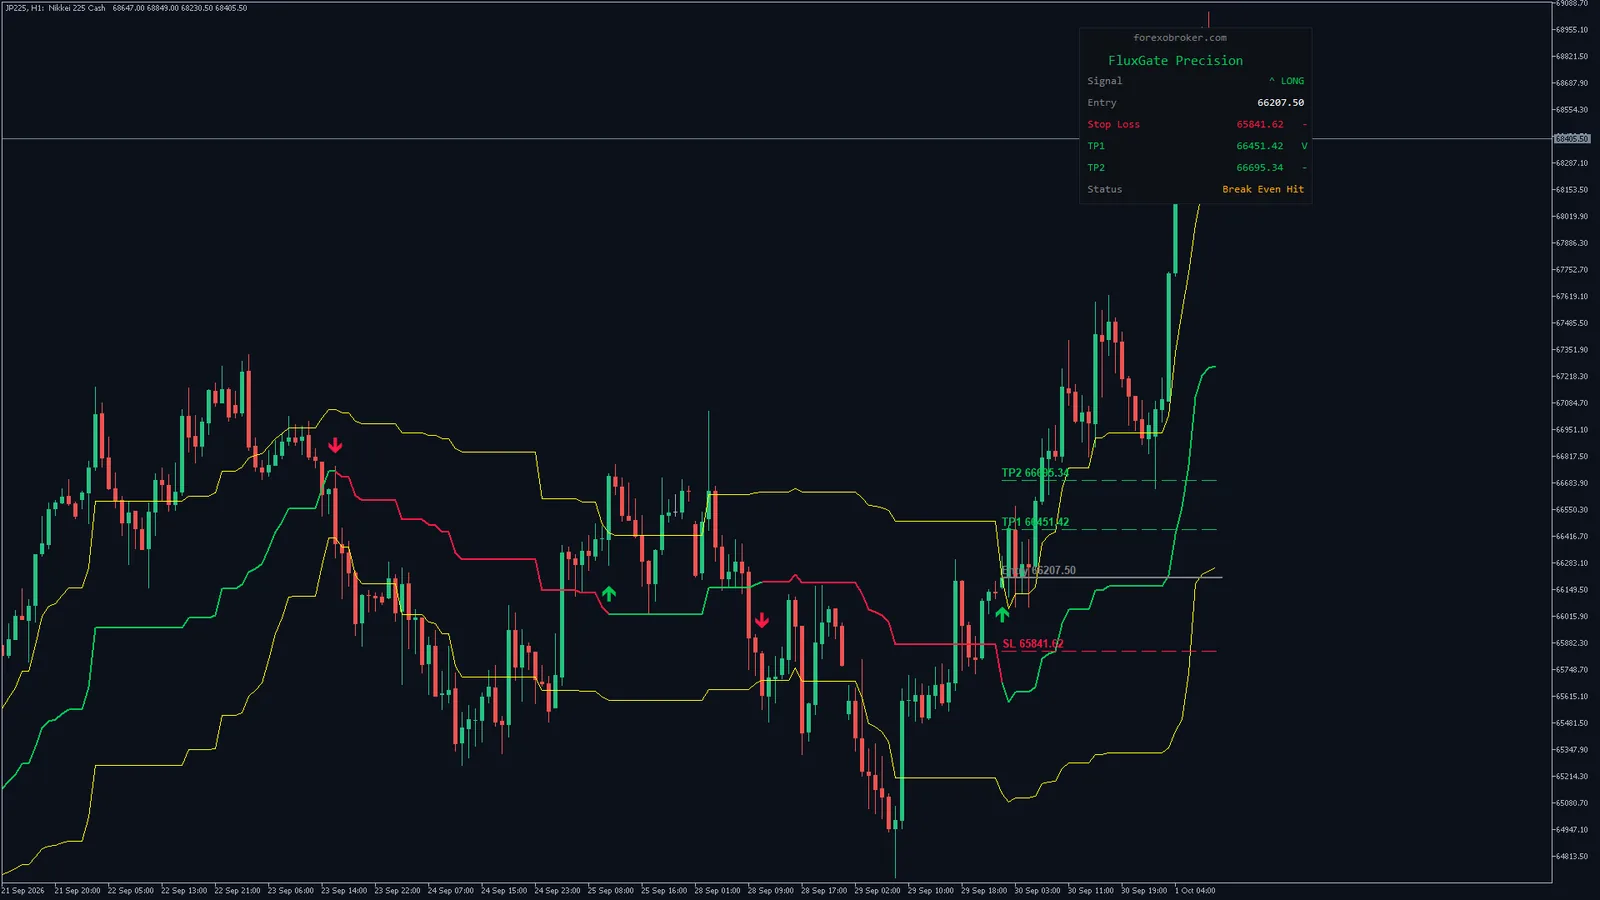
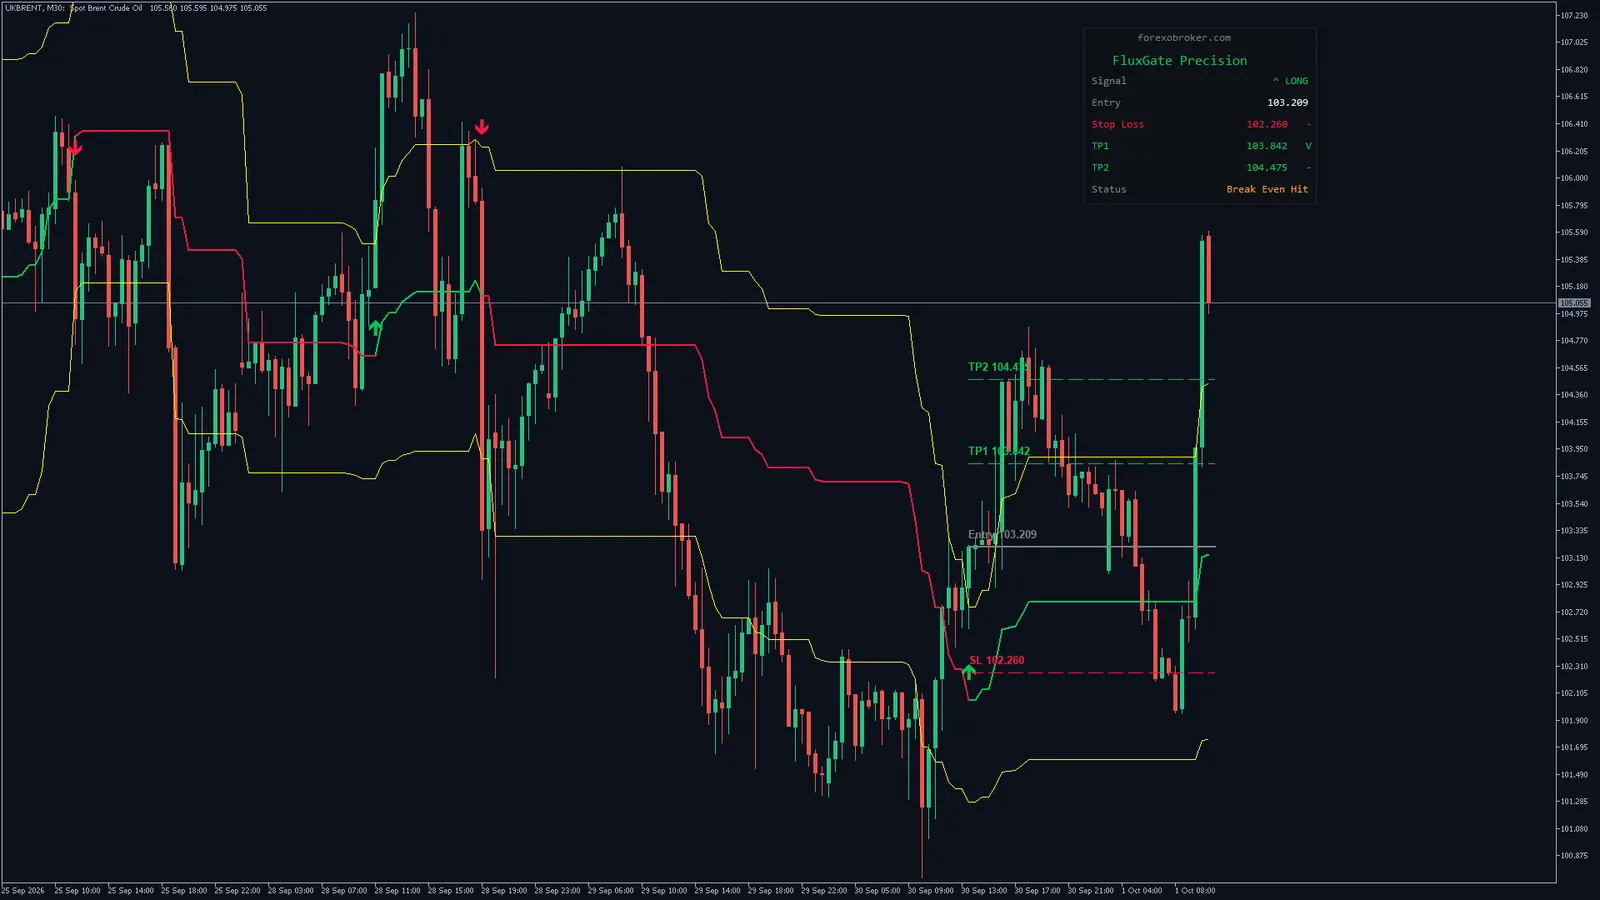
MetaTrader 43 charts
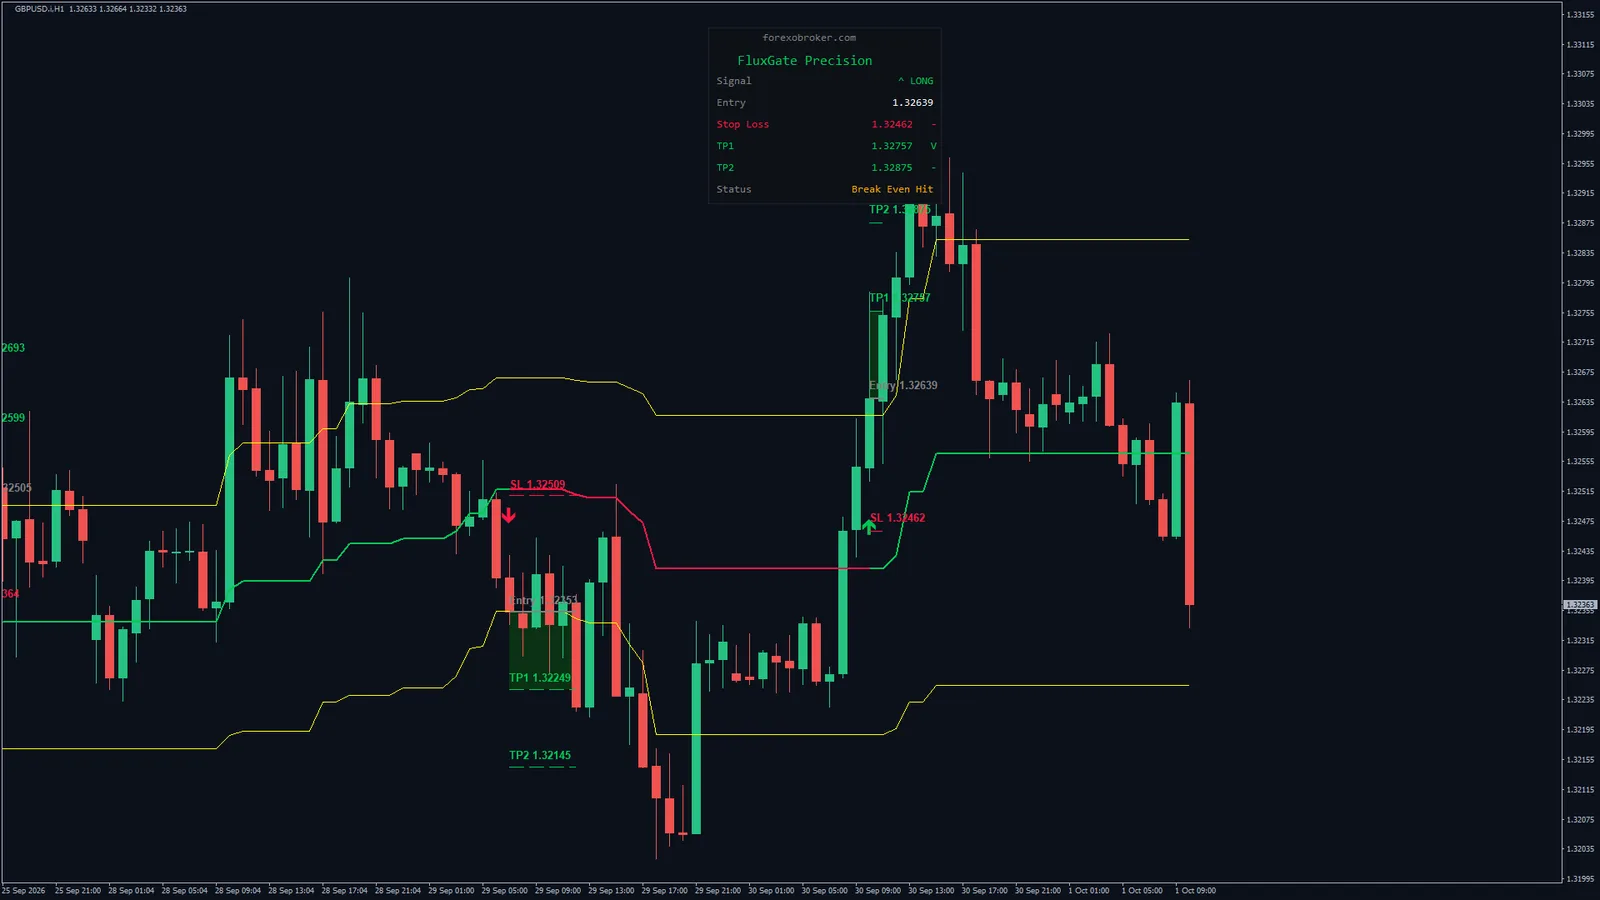
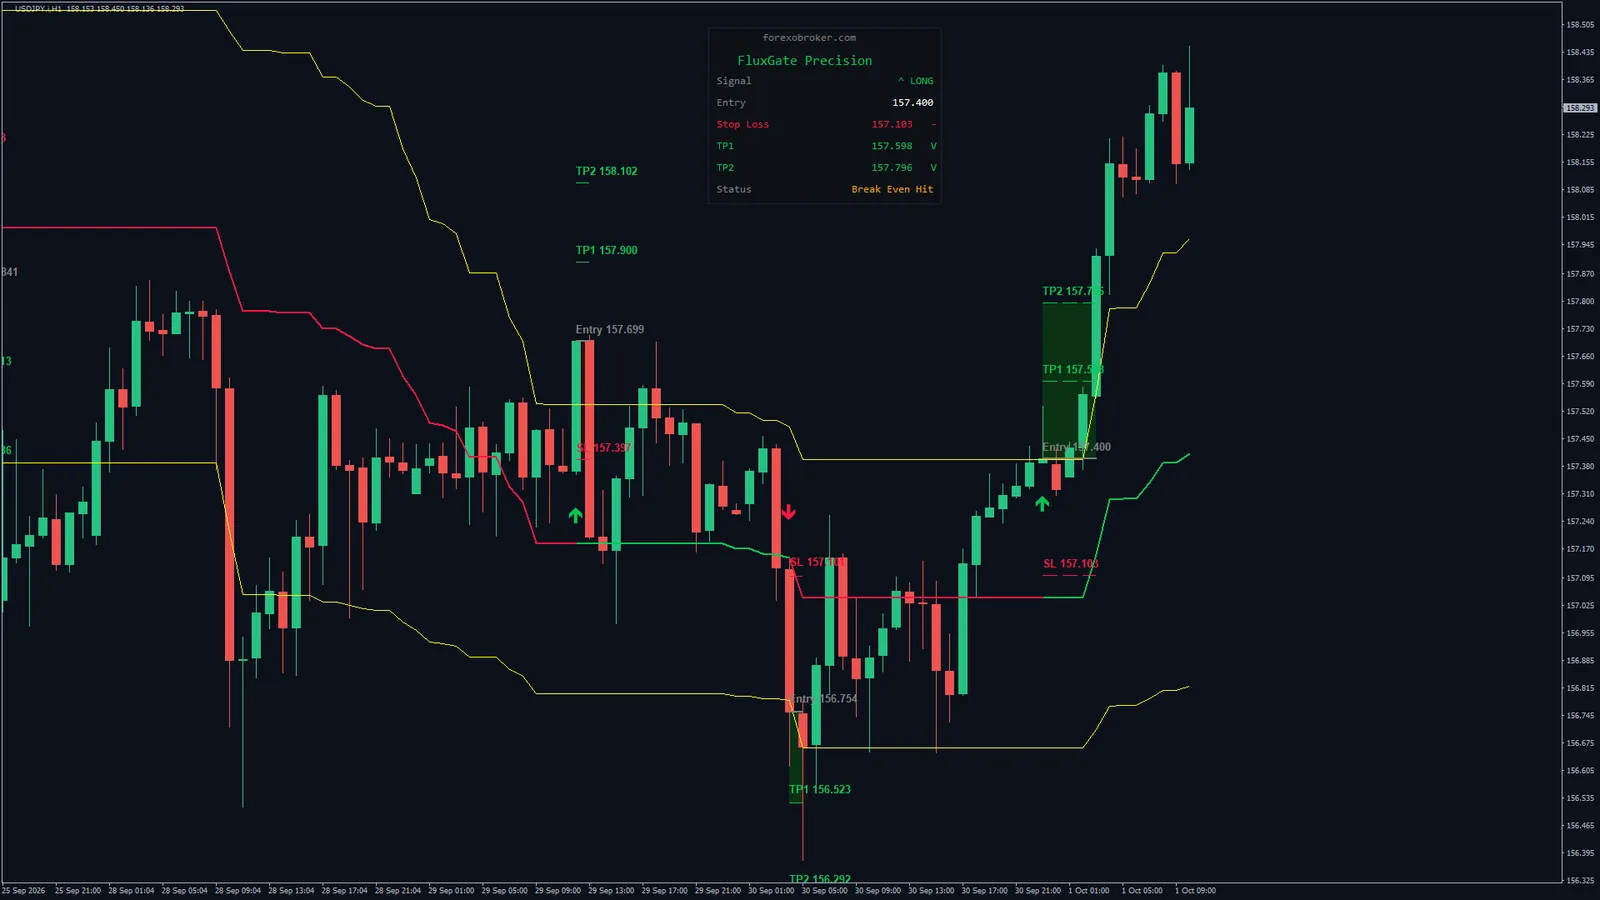
How these charts were captured. So you can repeat them, not just look at them.
- MetaTrader 5 build 6230 and MetaTrader 4 build 1479 on the Blueberry Markets Pty Ltd demo server (BlueberryMarkets-Demo), 1 October 2026. The terminal ran unattended: a helper script opened each chart, attached the shipped indicator with its default inputs, waited for it to finish drawing and saved the chart with MetaTrader's own screenshot function. No chart was edited afterwards.
- The dashboard values, the latest signal and the arrow counts on this page were read from each chart's own objects and indicator buffers at the moment of capture and stored next to the screenshot, so every figure traces to a file. Times are the broker's server time.
- Arrow counts cover the last 1,000 closed bars of each chart. Forex symbols on this feed carry a .i suffix, which is why the chart headers read EURUSD.i.
- Version 1.01 is the build on this page and in the download. Its buffers were compared with the previous build bar by bar on all 29 charts, 169,358 bar rows across six buffers, with zero differences.
One range, two gates, and a plan on every arrow
The whole engine fits in three short paragraphs, which is what makes it easy to check on a chart.
The range
On every bar the indicator takes the highest high and the lowest low of the last 44 bars, the Analysis Window. The middle of that range is the trend line, drawn green while the last signal was a BUY and red while it was a SELL.
The gates
Two yellow lines sit inside the range: the upper gate 23.6 percent below the high and the lower gate 78.6 percent below it. A BUY prints when a bar closes at or above the upper gate, a SELL when it closes at or below the lower gate. Signals alternate, so after a BUY the next arrow is always a SELL.
The plan
The signal bar's close is the entry. The stop goes 1.5 ATR away, TP1 at 1.0 ATR and TP2 at 2.0 ATR, with TP3 and TP4 one input away. After TP1 the exit steps to the entry, after TP2 to TP1, after TP3 to TP2, and the next signal replaces the trade.
Install the file for your platform
Copy the .ex4 into MQL4/Indicators or the .ex5 into MQL5/Indicators, refresh the Navigator and drag Flux Gate Precision onto any chart.
Start with the defaults
Watch a few signals form at 23.6 and 78.6 before you change anything. The manual has three starting points for a quieter or busier chart.
Read the dashboard
Signal, entry, stop, each target and the status, with V once price has touched a target and X once it has touched the stop.
Let the alerts call you
Popup, sound, push to the MetaTrader mobile app or email, for each of the eight events, on closed bars only.
The same signals, drawn two ways
Both builds compute the range, the gates, the arrows and the levels the same way from the same inputs, and both carry the same dashboard and alerts. Where they differ is what they leave on the chart once a trade is over. You should know that before you choose a platform, so here is gold on both, captured five minutes apart.
| MetaTrader 4 | MetaTrader 5 | |
|---|---|---|
| Arrows, gates and trend line | Identical | Identical |
| Stop and target lines | Every trade from the last 500 bars (Max Visual History), each cut where it ended | The latest trade only; its lines run on to the current bar |
| Green and red bands | A green band for each target reached, a red band on a stop | Not drawn |
| Dashboard | Identical | Identical |
| Alerts | Eight events, popup, sound, push, email | Eight events, popup, sound, push, email |
| Max Visual History input | Controls how far back old trades stay drawn | Kept for compatibility, no effect |
Three things a signal indicator should do, done properly
History you can trust
Every arrow is decided on a closed bar, so the arrows you scroll back through are the arrows you would have seen live. Only the gate and trend lines on the bar that is still forming move until it closes.
A complete plan on every arrow
Entry, stop and up to four targets appear with the arrow, sized to the market's own 14-period ATR, so a quiet chart gets tight levels and a fast one gets wide ones.
Both platforms, one purchase
The .ex4 and the .ex5 come in the same download with a manual for each, so moving between MetaTrader 4 and 5 costs nothing.
Flux Gate Precision next to the usual options
Where it wins, and where it does not. A tool that claims to win everywhere is the one to distrust.
| Flux Gate Precision | Typical free arrow indicators | Marking levels by hand | |
|---|---|---|---|
| Arrow stays where it printed | Decided on the closed bar | Many move or vanish before the bar closes | You decide |
| Stop and targets on every signal | ATR-sized, up to four targets | Usually the arrow only | If you have the time |
| Alerts on targets and stops | Eight events, popup, sound, push, email | Usually new signals only | You watch the chart |
| Follows several trades at once | No. One trade at a time; the next signal replaces it | Varies | As many as you can watch |
| Higher-timeframe filter | No. Check the bigger chart yourself | Varies | If you look |
Honest about who this fits
A good fit if you
- Want buy and sell signals that never move once they print, with the stop and targets already drawn.
- Trade forex, gold, silver, indices, oil or crypto on MetaTrader 4 or 5, on anything from M15 to H4.
- Like to see why a signal fired: a close through a line you can see on the chart.
Not for you if you
- Want an Expert Advisor that places trades for you. This is an indicator: it draws, tracks and alerts, and you place the orders.
- Need several overlapping trades tracked at once, or a higher-timeframe filter built in.
- Expect a win rate printed on the box. This page shows what the indicator does, not a promise of profit.
24 inputs, each one explained
The names are the ones you see in the MetaTrader inputs dialog. The defaults are what every chart on this page uses.
| Input | Default | What it does |
|---|---|---|
| Signal | ||
| Analysis Window | 44 | Bars in the rolling high-low range the gates are measured from. |
| Fib High Sensitivity | 23.6 | Where the upper gate sits below the range high. 23.6 is stricter (fewer signals), 38.2 looser (more). |
| Fib Low Sensitivity | 78.6 | Where the lower gate sits below the range high. 78.6 is stricter (fewer signals), 61.8 looser (more). |
| Stop and targets | ||
| Use ATR-Based TP/SL | On | On: stop and targets are ATR multiples. Off: they are percentages of the entry price. |
| ATR Period | 14 | ATR length used for the stop and target distances. |
| SL Multiplier | 1.5 | Stop distance in ATRs from the entry close. |
| TP1 Multiplier | 1.0 | TP1 distance in ATRs. TP1 is always on. |
| TP2 Multiplier (0=disable) | 2.0 | TP2 distance in ATRs. 0 switches TP2 off. |
| TP3 Multiplier (0=disable) | 0.0 | TP3 distance in ATRs. 0 switches TP3 off. |
| TP4 Multiplier (0=disable) | 0.0 | TP4 distance in ATRs. 0 switches TP4 off. Reaching TP4 ends the trade. |
| Break Even | On | After TP1 the exit steps to entry, after TP2 to TP1, after TP3 to TP2. |
| Manual stop and targets (when ATR is off) | ||
| Manual SL % | 0.8 | Stop distance as a percent of the entry price (ATR off). |
| Manual TP1 % | 0.65 | TP1 as a percent of the entry price (ATR off). |
| Manual TP2 % (0=disable) | 1.1 | TP2 percent. 0 switches it off. |
| Manual TP3 % (0=disable) | 0.0 | TP3 percent. 0 switches it off. |
| Manual TP4 % (0=disable) | 0.0 | TP4 percent. 0 switches it off. |
| Display | ||
| Show TP/SL Lines | On | Draws the entry, stop and target lines with price labels. |
| Show Signal Labels | On | Draws the BUY and SELL arrows. |
| Show Dashboard | On | Shows the dashboard panel in the top right corner. |
| Max Visual History (bars) | 500 | MT4: how far back finished trades keep their lines and bands. MT5 draws the latest trade only. |
| Alerts | ||
| Enable Popup Alerts | On | MetaTrader alert window (it plays its own sound). |
| Enable Push Notifications | Off | Push notification to the MetaTrader mobile app. |
| Enable Email Alerts | Off | Email through the terminal's mail settings. |
| Enable Sound Alerts | On | Plays alert.wav. |
Eight events, four ways to hear about them
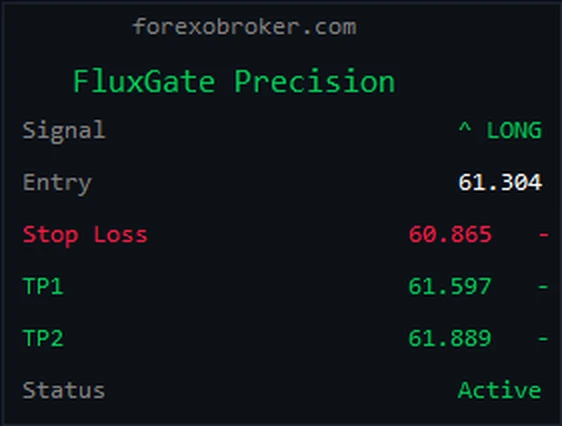
Every event fires once, on the bar that closes it, and only after the indicator has loaded, never for history. The message names the symbol and timeframe, so one alert window can serve every chart you run it on. Here they are as they arrive, with EURUSD H1 as the example:
- FluxGate BUY signal on EURUSD H1
- FluxGate SELL signal on EURUSD H1
- FluxGate TP1 Hit on EURUSD H1
- FluxGate TP2 Hit on EURUSD H1
- FluxGate TP3 Hit on EURUSD H1
- FluxGate TP4 Hit on EURUSD H1
- FluxGate SL Hit on EURUSD H1
- FluxGate Break Even on EURUSD H1
Each event can reach you as a MetaTrader popup, a sound, a push notification to the MetaTrader mobile app or an email, with one switch per channel. Tip: the popup plays its own sound, so with both Popup and Sound on you will hear two; turn Sound off if you use popups.
Two builds, two manuals, nothing left to configure
- 2Indicator builds, version 1.01FluxGate_Precision.ex4 for MetaTrader 4 and FluxGate_Precision.ex5 for MetaTrader 5, in one 3.4 MB download.
- 2PDF manualsOne per platform, 21 and 21 pages: install, every input, the gates, the trade plan, alerts and troubleshooting.
- 24InputsGates, ATR or percentage levels, up to four targets, break-even, and display and alert switches.
- 8Alert eventsBUY, SELL, TP1 to TP4, stop and break-even, by popup, sound, push or email.
- 4Targets per signal, at mostTP1 always on, TP2 on by default, TP3 and TP4 one input away.
- 60Day money-back guaranteeIf it is not for you, email within 60 days of purchase for a full refund.

Dominic Walsh
Founder, forexobroker.com
I have traded forex since 2014 and started writing about it the same year. forexobroker.com now reaches over 40,000 readers a month, and every indicator, Expert Advisor and tutorial on it is something I have built, tested or used in my own trading.
Flux Gate Precision is the range-break tool I wanted on my own charts: one rule I can see, a plan drawn on every arrow, and nothing that changes after the bar closes. The charts on this page were captured from the shipped build at its default settings and are shown unedited.
No get-rich claims and no win rates. Trading is a probability business. If you want to know whether it suits the way you trade before you buy, email me at [email protected] and I will tell you straight.
One price, both platforms
- Both builds: .ex4 for MetaTrader 4 and .ex5 for MetaTrader 5
- Two PDF manuals, one per platform
- 24 inputs, 8 alert events, up to 4 targets per signal
- Instant download and a 60-day money-back guarantee
60-day money-back guarantee. Install it, run it on your own markets and read the manual. If Flux Gate Precision is not for you within 60 days of purchase, email [email protected] for a full refund, no questions asked. Files are delivered instantly on a secure download page after checkout. This is a software tool, not financial advice.
Answered straight
The things people actually email about before buying. If yours is not here, ask before you buy at [email protected].
How it works
Does it repaint?
No. Every signal, target, stop and break-even check is evaluated on a closed bar, so an arrow that has printed stays where it is. The arrow appears once the bar that closed through the gate is complete, which in practice is when the next bar opens. What does move is the pair of gates and the trend line on the bar that is still forming, because the range itself keeps changing until that bar closes.
What exactly triggers a BUY or a SELL?
A BUY needs a bar to close at or above the upper gate, which by default sits 23.6 percent below the highest high of the last 44 bars. A SELL needs a close at or below the lower gate, 78.6 percent below that high. Signals alternate: after a BUY the indicator waits for a SELL and the other way round, so you never get two BUY arrows in a row.
How are the stop and the targets set?
From the signal bar's close and the 14-period ATR at that bar: the stop 1.5 ATR away, TP1 at 1.0 ATR and TP2 at 2.0 ATR, with TP3 and TP4 off until you give them a multiplier. Switch Use ATR-Based TP/SL off and the levels become percentages of the entry price instead. At the defaults TP1 is nearer than the stop, which suits a trader who banks part of a position early; if you want every target beyond the stop distance, raise TP1 or lower the stop multiplier.
What does break-even do?
It is a stepped exit, not a moving stop line. Once TP1 has been touched the trade counts as closed if price comes back to the entry; after TP2 the exit moves up to TP1, after TP3 to TP2. The stop line on the chart does not move and the break-even level is not drawn, so read the dashboard status, which changes to Break Even Hit when that exit is reached. Keep TP1 to TP4 in ascending order, because each step assumes the next target is further away.
What changed in version 1.01?
Only two dropdown labels. Earlier builds described 23.6 and 78.6 as the more sensitive settings; in fact they are the stricter ones and fire fewer signals, because price has to travel further through the range to reach them, as the frequency table shows. Version 1.01 labels them correctly. Nothing else changed: on all 29 charts on this page every buffer of 1.01 matched the earlier build bar for bar, so saved settings and templates load as before.
The proof
Are the charts on this page real?
Yes. Each one was saved by MetaTrader itself from a live chart on the Blueberry Markets Pty Ltd demo server on 1 October 2026, with the shipped indicator attached at its default inputs, and none was edited. The dashboard values and arrow counts printed next to them were read from the same charts at the same moment.
What is the win rate?
This page does not print one, on purpose. A win rate depends on the market, the timeframe, the period and on whether a touched TP1 counts as a win, and any single number would flatter some charts and hide others. The frequency table tells you how often it fires, and the charts show signals that reached targets next to signals that were stopped. Test it on a demo account on your own markets before you trade it.
How often will I get a signal?
At the default gates, between 12 and 26 times per 1,000 bars on the 25 charts we measured, roughly one signal every 38 to 83 bars. Moving both gates to 38.2 and 61.8 gave 21 to 45. On a forex H1 chart that works out at about two signals a week.
Does it work on gold, indices and crypto?
Yes. It reads only price, so it runs on any symbol your broker quotes. We captured and measured it on 22 markets across forex, gold, silver, stock indices, oil and crypto, from M15 to H4. The levels are drawn on the chart price and are not adjusted for spread, so allow for it on instruments where the spread is wide.
Using it
MetaTrader 4 or 5: which should I use?
Whichever your broker offers; the signals are the same. MetaTrader 4 keeps the levels of past trades and shades every target reached in green and every stop in red. MetaTrader 5 draws the latest trade only and keeps its lines running to the current bar. Both builds are in the download.
Which timeframes work best?
The engine is the same on every timeframe, and the frequency table shows it fires at a similar rate per bar from M15 to H4. Lower timeframes give more signals per day and smaller ATR levels, which spreads and commissions eat into more. M15 to H4 is where every chart on this page was taken.
Can I read its signals from an Expert Advisor?
Yes. Buffers 4 and 5 hold the BUY and SELL arrows and are empty when there is no signal; buffers 0 to 3 hold the gates and the trend line. The manual gives the iCustom call. The indicator itself never places a trade.
Will it trade for me?
No. It is an indicator: it draws the signal, the levels and the dashboard and raises the alerts. You place and manage the orders, with whatever position size and risk your account allows.
What do V and X on the dashboard mean?
V means price has touched that target since the signal and X that it has touched the stop. They describe the chart, not your orders: if you entered later than the signal bar's close, your own fills will differ.
After you buy
How do I get it after paying?
Checkout takes you straight to a private download page with one zip holding both builds and both manuals. Bookmark that page for re-downloads.
Do I get updates?
Yes. Free updates to the current version are posted on the same download page.
Do I get the source code?
No. The download holds the compiled .ex4 and .ex5 files and the two manuals.
What is the refund policy?
A 60-day money-back guarantee. If Flux Gate Precision is not for you within 60 days of purchase, email [email protected] for a full refund, no questions asked.
Signals that stay put, with the plan already on the chart.
Both builds, two manuals and every input explained. Instant download for $47 at the launch price.
Get instant access