Mth Adx Sma Cross System Review
The MTH ADX SMA Cross System is a popular trading strategy that utilizes two technical indicators: the Average Directional Movement Index (ADX) and the Simple Moving Average (SMA). The ADX measures the strength of a trend, while the SMA provides insight into price movements over a specified period.
This system combines these two indicators to identify potential entry and exit points in the market. Traders who implement this system aim to capitalize on trends in various financial markets, including stocks, commodities, and currencies.
Download Free Mth Adx Sma Cross System
By understanding how these indicators work together and recognizing their strengths and limitations, traders can make informed decisions about when to enter or exit trades. In this article, we will delve into the details of the MTH ADX SMA Cross System, exploring its components and providing tips for effective implementation.
Understanding the ADX and SMA Indicators
The current section delves into the understanding of two technical indicators, where one measures trend strength and the other calculates an average price over a specified period.
The Average Directional Index (ADX) is a popular indicator used to measure the strength of a trend. It was developed by J. Welles Wilder Jr., who also created other well-known indicators such as Relative Strength Index (RSI) and Parabolic SAR. ADX ranges from 0 to 100, with values above 25 indicating a strong trend and values below 20 indicating a weak trend or no trend at all.
One common misconception about ADX is that it can be used to determine the direction of the trend. However, this is not true as ADX only measures the strength of the trend, not its direction. Another misconception is that higher ADX values always indicate bullish trends while lower values indicate bearish trends. This is also incorrect as ADX does not differentiate between bullish or bearish trends; it only indicates whether there is a strong or weak trend in place.
On the other hand, Simple Moving Average (SMA) calculates an average price over a specified period and helps traders identify potential support and resistance levels in the market. Unlike ADX, SMA can be used to determine both direction and momentum of trends in addition to identifying key levels for entry and exit points.
The main difference between ADX and other trend indicators like Moving Average Convergence Divergence (MACD) or Ichimoku Clouds lies in their calculation methods. While MACD uses exponential moving averages to calculate momentum changes in price action, Ichimoku Clouds use multiple lines that provide information on support/resistance levels along with momentum changes. In contrast, ADX solely focuses on measuring how strong or weak a particular trend may be without providing any additional information on potential reversal points or entry/exit signals like MACD or Ichimoku Clouds do.
How the MTH ADX SMA Cross System Works
Understanding the mechanics of a trend following strategy that utilizes two technical indicators to identify potential entry and exit points can provide traders with an edge in navigating market movements.
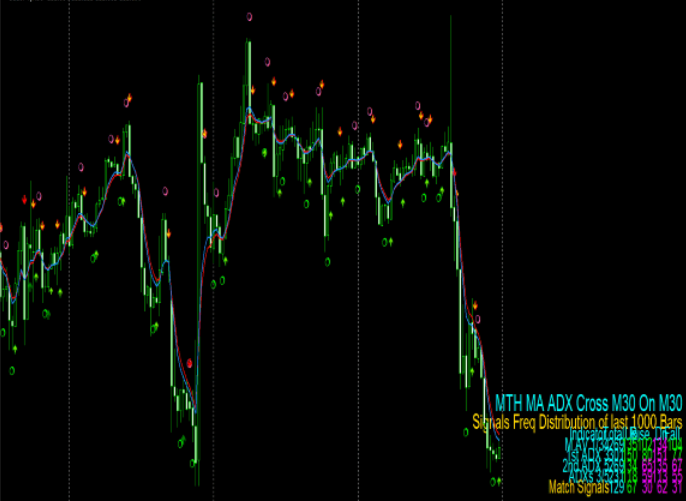
The MTH ADX SMA Cross System is one such strategy that aims to capture trends using the Average Directional Index (ADX) and Simple Moving Average (SMA) indicators. When the 20-period SMA crosses above or below the 50-period SMA, it indicates a potential change in trend direction. The ADX helps filter out false signals by measuring the strength of the trend.
Backtesting results have shown that this system can generate profits over time, especially in trending markets where momentum is strong.
However, there are some potential drawbacks to consider when implementing this strategy. First, it may not perform well in choppy or range-bound markets where price swings back and forth without establishing a clear trend. Second, relying solely on technical indicators without considering fundamental factors or news events may lead to missed opportunities or unexpected losses. Finally, as with any trading system, past performance does not guarantee future results so traders should always exercise caution and risk management strategies when trading with this system.
Tips for Using the MTH ADX SMA Cross System Effectively
To optimize the efficiency of this trend following strategy, traders may benefit from incorporating additional technical indicators or fundamental analysis to confirm potential trade signals and avoid false positives.
The MTH ADX SMA Cross System is a simple yet effective trading system that generates buy and sell signals based on the intersection of moving averages and the ADX indicator. However, as with any trading system, it is not foolproof and can generate false signals at times.
One way to minimize risks when using this system is to wait for confirmation from other indicators before entering a trade. For example, traders could use support and resistance levels, candlestick patterns or price action analysis to validate potential trade setups.
Additionally, incorporating fundamental analysis such as news events or economic data releases can also provide further confirmation of potential market movements. By doing so, traders can maximize profits while minimizing risks when using the MTH ADX SMA Cross System.
Conclusion
In conclusion, the MTH ADX SMA Cross System is a popular trading strategy for both novice and experienced traders. The system utilizes two common technical indicators, the ADX and SMA, to identify potential trend reversals and generate buy/sell signals.
Understanding how each indicator works and their respective strengths and weaknesses is crucial for maximizing profitability using this system. Additionally, incorporating other technical analysis tools such as support/resistance levels or candlestick patterns can enhance the accuracy of signals generated by the MTH ADX SMA Cross System.
As with any trading strategy, it is important to conduct thorough backtesting and risk management before implementing in live markets.
