Ichimoku Average Mt4 Indicator Review
The Ichimoku Average MT4 Indicator is a popular technical analysis tool used by traders to identify trends, support and resistance levels, and potential price reversals in financial markets. Developed by Japanese journalist Goichi Hosoda in the late 1930s, the indicator has gained widespread popularity among traders around the world for its ability to provide a comprehensive view of market conditions.
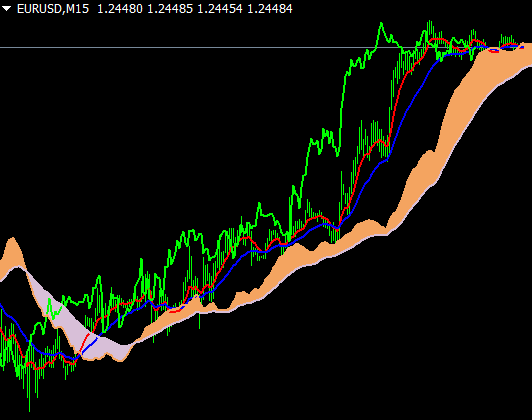
Download Free Ichimoku Average Mt4 Indicator
This article will explore the history and development of the Ichimoku Average MT4 Indicator, as well as its five lines and how they can be used in trading strategies. Additionally, we will discuss tips for maximizing the effectiveness of this powerful technical indicator.
Whether you are an experienced trader or just starting out in financial markets, understanding how to use the Ichimoku Average MT4 Indicator can help you make better-informed trading decisions.
The History and Development of the Ichimoku Average MT4 Indicator
The history and development of the technical analysis tool being discussed in this current section can be traced back to Japan in the early 20th century, where a journalist named Goichi Hosoda developed a trading system that incorporated various indicators to analyze market trends. Hosoda’s system was known as Ichimoku Kinko Hyo, which translates to ‘one glance equilibrium chart.’
The significance of Ichimoku Average lies in its ability to provide a comprehensive view of price action, enabling traders to identify trends, gauge momentum and support/resistance levels. Over time, the Ichimoku Kinko Hyo system has evolved into one of the most widely used technical analysis tools globally. It is particularly popular among Forex traders but is also applied across other financial markets such as stocks and commodities.
Its popularity stems from its versatility as it accommodates different styles of trading including swing trading and trend following. Overall, the evolution of Ichimoku Average has led to its wide adoption by traders looking for an all-inclusive approach to analyzing financial markets.
Understanding the Five Lines of the Ichimoku Average MT4 Indicator
This section delves into the five lines that are utilized in the analysis of the Ichimoku chart, each providing a unique perspective on price action and trend identification.
The first line is Tenkan-sen or conversion line, which measures short-term momentum, calculated as the average of the highest high and lowest low over nine periods. When Tenkan-sen moves above Kijun-sen (the next line), it signals a bullish trend, while a bearish trend is indicated when it crosses below Kijun-sen.
The second line, Kijun-sen or base line, represents medium-term support/resistance levels and calculates by measuring the highest high and lowest low over 26 periods.
The third line is Senkou Span A or leading span A, which creates one-half of the cloud component (a shaded area between Senkou Span A and B) in an Ichimoku chart. It represents potential future resistance/support levels based on an average of Tenkan-sen and Kijun-sen shifted ahead 26 periods.
Senkou Span B or leading span B calculates similarly to Span A but uses the highest high/lowest low over 52 periods shifted ahead 26 periods to create another half of the cloud component.
Line interpretations provide different perspectives on price action that traders can use to identify trends’ strength and direction. Trading examples include using crossovers between Tenkan-sen/Kijun-sen as entry/exit signals; observing how price interacts with Cloud components for support/resistance confirmation; monitoring Chikou Span’s position relative to past prices for confirming signal reversals.
How to Use the Ichimoku Average MT4 Indicator in Your Trading Strategy
Incorporating the analysis and interpretations of multiple lines within a chart, traders can utilize the Ichimoku tool to identify potential trends, entry/exit signals, and support/resistance levels in their trading strategy.
Specifically, using the Ichimoku Average MT4 Indicator in trend trading involves observing the interactions between the various lines on the chart to determine if an asset is trending upwards or downwards.
If all five lines are above the price action, this indicates a bullish trend; conversely, if all five lines are below the price action, this suggests a bearish trend.
In addition to using Ichimoku as a standalone indicator for spotting trends and key levels of support/resistance, traders may also choose to incorporate it with other technical indicators.
Some examples include combining Ichimoku with moving averages or oscillators such as RSI or MACD.
This can provide additional confirmation for trades by analyzing signals from multiple sources simultaneously.
However, it’s important to note that no single indicator is foolproof and should always be used in conjunction with proper risk management techniques.
Tips for Maximizing the Effectiveness of the Ichimoku Average MT4 Indicator
To optimize the effectiveness of the Ichimoku Average MT4 Indicator, traders can implement various strategies such as adjusting the time frame, using multiple indicators for confirmation, and backtesting their trading plan. Firstly, adjusting the time frame can help traders identify trends and potential entry and exit points more accurately. For example, a longer time frame may provide a better understanding of long-term trends while a shorter time frame may be suitable for short-term trades.
Secondly, using multiple indicators for confirmation can help reduce false signals and increase the accuracy of trading decisions. Traders can use other technical analysis tools such as moving averages or trend lines in conjunction with the Ichimoku Average MT4 Indicator to confirm potential trade setups. Additionally, backtesting their trading plan using historical data can help traders evaluate their strategy’s performance under different market conditions and make necessary adjustments to improve its effectiveness.
The following table summarizes some best practices that traders can follow to maximize the effectiveness of the Ichimoku Average MT4 Indicator:
| Best Practices | Description |
|---|---|
| Adjust Time Frame | Use longer time frames for long-term trends and shorter ones for short-term trades |
| Use Multiple Indicators | Combine with other technical analysis tools like moving averages or trend lines for confirmation |
| Backtest Trading Plan | Test strategy’s performance under different market conditions using historical data |
By implementing these best practices, traders can effectively use the Ichimoku Average MT4 Indicator as part of their technical analysis toolkit to make informed trading decisions.
Conclusion
The Ichimoku Average MT4 indicator is a valuable tool for traders looking to improve their technical analysis skills. Developed by Japanese journalist Goichi Hosoda in the 1930s, the indicator uses five lines to provide a comprehensive view of price action and trend direction.
Traders can use the Ichimoku Average MT4 indicator in a variety of ways, including identifying support and resistance levels, determining entry and exit points, and confirming trends.
To maximize the effectiveness of the Ichimoku Average MT4 indicator, it is important to understand each line’s significance and how they interact with one another. Additionally, traders should consider combining the indicator with other technical analysis tools and incorporating fundamental analysis into their trading strategy.
Overall, mastering the Ichimoku Average MT4 indicator takes time and practice but can greatly enhance your trading abilities. With its long history of success in Japan and increasing popularity around the world, this powerful tool has proven itself as an essential component of any trader’s toolkit.
