The Top 10 Best Indicators for Day Trading
Day trading involves making multiple trades within a single trading day, with the goal of profiting from short-term market moves. Having the right indicators can be crucial for identifying these opportunities and executing effective day trades. This comprehensive guide explores the 10 most useful indicators for day trading.
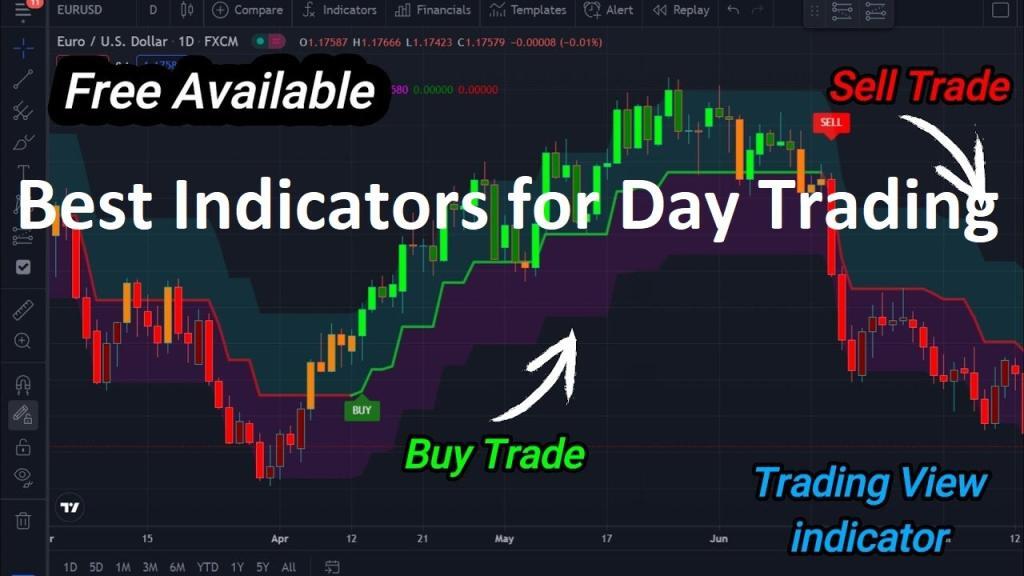
Download Best Indicators for Day Trading
What are Indicators and How are They Used in Day Trading?
Technical indicators are mathematical calculations based on a stock’s price, volume or other metrics. They are plotted as visual overlays on trading charts to help traders analyze market conditions and identify potential trading opportunities.
Indicators can track momentum, volatility, trends, and other key factors. There are hundreds of different indicators to choose from, but day traders typically focus on a select few that suit their strategy.
Some of the main ways indicators are used in day trading include:
- Identifying overbought/oversold conditions
- Spotting divergences that may signal reversals
- Determining the strength and direction of a trend
- Confirming trade signals generated by other indicators or analysis
- Establishing support and resistance levels
When used properly, indicators can provide objective insight into price action. However, they should not be relied on exclusively. Indicators are best used in conjunction with other forms of analysis to validate trading signals.
The Top 10 Best Indicators for Day Trading
Here are 10 of the most popular, effective indicators for day trading across various asset classes.
1. Moving Averages
Moving averages are one of the most basic yet versatile indicators. They smooth out price action by averaging closing prices over a set time period, usually 20, 50, 100, or 200 days.
The key moving averages watched by day traders are the 20 and 50-day simple moving averages (SMAs). Shorter SMAs are faster and more responsive, while longer SMAs provide support and resistance.
Moving average crossovers, when a shorter SMA crosses above or below a longer SMA, can signal trend changes. Moving averages can also identify dynamic support and resistance levels.

Access my advanced Spark Impulse Indicator for Tradingview platform
2. Bollinger Bands
Bollinger Bands consist of a center 20-day SMA line with an upper and lower band plotted at two standard deviations above and below the SMA. They indicate whether prices are relatively high or low compared to recent volatility.
During periods of low volatility, the bands contract. When volatility increases, the bands widen. Sharp price moves that break above or below the bands signal overbought or oversold conditions.
Day traders look to buy dips down to the lower band and sell rallies up to the upper band. The bands also provide dynamic support and resistance.
3. Relative Strength Index (RSI)
The RSI is a momentum oscillator that measures the speed and rate of price movements. It oscillates between 0 and 100. Readings under 30 indicate oversold conditions, while readings over 70 indicate overbought conditions.
Divergences between price and the RSI, such as the price making new highs while the RSI fails to exceed its previous high, can signal a trend reversal. Traders look to buy when the RSI reading falls below 30 and sell when it rises above 70.
4. MACD (Moving Average Convergence Divergence)
The MACD is calculated by subtracting a 26-day exponential moving average (EMA) from a 12-day EMA. This oscillating indicator has a signal line, which is a 9-day EMA of the MACD.
MACD trading signals are generated when the MACD line crosses above or below the signal line. Crossovers into positive territory signal upward momentum, while crossovers into negative territory signal downward momentum.
5. Stochastic Oscillator
The stochastic oscillator compares a stock’s closing price to its price range over a set period of time. The result is displayed as two lines – %K and %D – that oscillate between 0 and 100.
Readings under 20 indicate oversold conditions, while readings over 80 indicate overbought conditions. When %K crosses above %D, it signals upward momentum is increasing. When %K crosses below %D, it signals that downward momentum is increasing.
6. On-Balance Volume (OBV)
OBV measures buying and selling pressure by tracking trading volume. It adds volume on up days and subtracts volume on down days. Rising OBV indicates increased buying pressure, while falling OBV indicates increased selling pressure.
Divergences between OBV and price, such as OBV making new highs while the price fails to reach new highs, can indicate waning momentum. Traders look to buy when OBV begins to rise after falling and sell when it begins to fall after rising.
7. Average Directional Index (ADX)
The ADX measures trend strength without regard to trend direction. It oscillates between 0 and 100, with readings above 25 indicating a strong trend.
Day traders can use the ADX to determine when markets are trending strongly and isolate ranging, non-trending markets. The ADX can signal when existing trends are losing momentum and new trends are setting up.
Download my PRO Forex Titan 50 Strategy
8. Keltner Channels
Keltner Channels plot upper and lower bands around a 20-day EMA. The bands are based on the Average True Range (ATR) of the stock over the past 20 days. Wider channels indicate higher volatility.
Price breaking above the upper band shows strong upward momentum, while breaking below the lower band shows strong downward momentum. Keltner Channels also provide dynamic support and resistance levels.
9. Volume
Volume reflects the number of shares traded over a set period of time. High volume indicates increased market participation and liquidity. Day traders want to see surges in volume when prices break out to new highs or lows.
Low volume environments are avoided by day traders, as low liquidity can exaggerate price movements. Sustained price moves on high volume provide confirmation of breakouts and trend strength.
10. Support and Resistance
While not a technical indicator per se, key support and resistance levels are widely used by day traders. Support levels indicate where demand is likely strong enough to prevent the price from falling further. Resistance levels indicate where supply is likely strong enough to prevent the price from rising further.
Day traders look to buy at or near support and sell at or near resistance. Support and resistance are often set at psychologically significant round numbers like 10, 20, 50, 100, and 200.
Putting the Indicators Together
The best day trading results typically come from combining indicators together to validate trading signals and gain a more complete market perspective. For example, overbought/oversold oscillators like RSI or stochastics can be used to confirm trade signals generated by a moving average crossover.
Indicators can also be used to set profit targets and stop losses. For example, entering a long trade.
Using Indicators to Confirm Trade Signals
Indicators become even more powerful when used together to confirm trade signals and provide greater confidence in potential setups. Here are some examples of using indicators in combination:
- The MACD line crossing above its signal line, while the RSI rises above 50 and Stochastics %K crosses above %D could flag an impending upside breakout. Multiple indicators reflecting building upside momentum increase conviction in an upside trade.
- A death cross, with a 50-day SMA crossing below a 200-day SMA, along with the ADX turning down from above 25, signals a potential shift from an uptrend to a downtrend. Combining trend-following indicators identifies shifts early.
- As the price pulls back to test support around the 20-day SMA, oversold readings on the RSI and rising OBV signals improving demand. These indicators help confirm support will likely hold.
- A bullish engulfing candlestick pattern forms at resistance defined by the upper Keltner Channel band. The Stochastics oscillator is rising from oversold levels below 20. Multiple indicators suggest an upside breakout is forthcoming.
Optimizing Indicators for Day Trading
Indicators should be optimized for the timeframe and instrument being traded. The settings that work well for swing trading may not be ideal for day trading. Some tips for optimizing indicators include:
- Use shorter timeframes for faster indicators. For day trading, 5-minute, 15-minute and hourly charts are common. Indicators based on 20 or 50 periods work well on these timeframes.
- Adjust the lookback periods. For example, shorten moving averages to 10 or 20 periods or lower Bollinger Bands to 2 standard deviations for greater sensitivity.
- Experiment to find the ideal settings. Tweak the indicator lookback periods, smoothing, signal lines, etc. to best capture moves.
- Focus on a few indicators. Using 3-5 indicators tops helps avoid analysis paralysis from too much conflicting data.
Common Day Trading Indicator Mistakes
Some common mistakes traders make with indicators:
- Relying solely on indicators. Indicators work best when combined with chart patterns, candlesticks, support/resistance, trend analysis and price action.
- Not confirming signals. Look for agreement between multiple indicators rather than relying on just one.
- Overoptimizing. Curve fitting will lead to unreliable signals. Periods should be set based on the market, not just backtested results.
- Lagging signals. Indicators are based on past data and always lag price. Acting quickly on signals is key.
- No exit strategy. Have a plan to book profits and cut losses. Don’t stay married to a position just because an indicator hasn’t reversed yet.
Check my Chart Patterns PDF Course
Frequently Asked Questions
Q: What is technical analysis?
A: Technical analysis is a method of analyzing financial markets by studying historical price and volume data. Traders use technical analysis to identify patterns, trends, and indicators to make trading decisions.
Q: What is a moving average?
A: A moving average is a widely used technical indicator that calculates the average price of a security over a specific period. It smooths out price fluctuations and helps traders identify the overall direction of a trend.
Q: What is the relative strength index (RSI)?
A: The relative strength index (RSI) is a popular momentum indicator that measures the speed and change of price movements. It helps traders identify overbought and oversold conditions and potential trend reversals.
Q: What are intraday trading indicators?
A: Intraday trading indicators are technical analysis tools specifically designed for short-term trading. These indicators help traders identify potential entry and exit points based on intraday price movements.
Q: What are some useful intraday trading indicators?
A: Some useful intraday trading indicators include the moving average, relative strength index (RSI), volume indicator, and trading range indicators. These indicators help traders analyze market trends, momentum, and trading volume.
Q: How can I combine trading indicators for day trading?
A: To combine trading indicators for day trading, you can use multiple indicators to confirm signals and increase the accuracy of your trading decisions. For example, you can use the moving average and RSI together to identify trend reversals and potential entry points.
Q: Which indicators are best for intraday trading?
A: The best indicators for intraday trading depend on your trading strategy and preferences. However, some popular indicators for intraday trading include the moving average, RSI, volume indicator, and MACD (Moving Average Convergence Divergence).
Q: How can technical indicators help in day trading?
A: Technical indicators can help in day trading by providing objective and data-driven insights into market trends, momentum, and price movements. Traders can use these indicators to spot potential entry and exit points, optimize their trading strategies, and make informed trading decisions.
Q: What types of indicators are available for day trading?
A: There are various types of indicators available for day trading, including trend indicators, momentum indicators, volume indicators, and volatility indicators. Each type of indicator provides different insights into market conditions and can be used to develop different trading strategies.
Key Takeaways on the Best Indicators for Day Trading
Here are some key points on effectively utilizing indicators for day trading:
- Combine indicators together to validate signals and get a complete market perspective. Relying on just one indicator is risky.
- Use indicators to confirm chart patterns, candlesticks, and other analysis. Indicators work best when confirming other signals.
- Customize indicators to optimize them for day trading timeframes and instruments. Default settings may not work best.
- Focus on a handful of indicators that complement your trading strategy and style. Too many indicators creates clutter.
- Remember that indicators lag price. Act quickly on signal but exercise patience for confirmation.
- Have a trading plan for entries and exits. Indicators identify opportunities, but a trading plan captures profits.
With the right selection of indicators and optimal usage, technical indicators can take day trading results to the next level. However, proper analysis, risk management and trading discipline are still essential. Indicators are powerful tools, but only when applied effectively within a structured trading plan.