Camarilla Pivot Points Indicator Review
The Camarilla Pivot Points Indicator is a technical analysis tool used by traders to identify potential support and resistance levels in the financial markets.
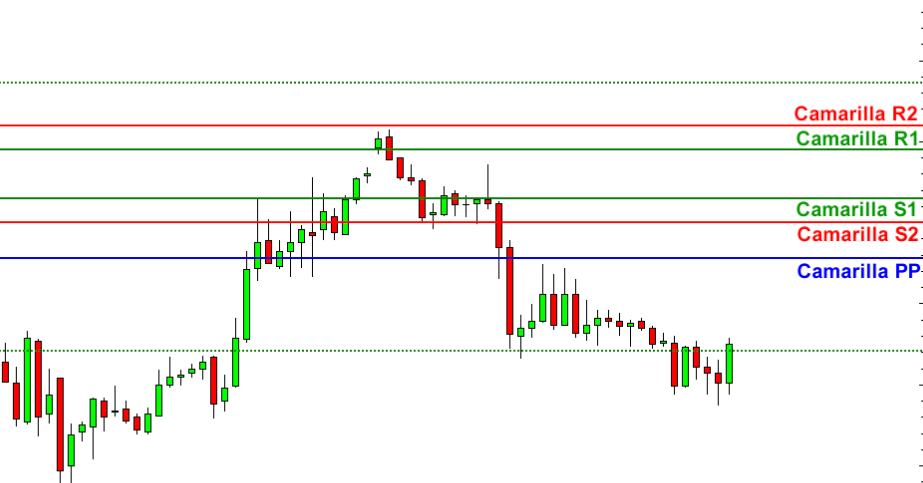
Developed by trader Nick Stott, this indicator is based on a mathematical formula that uses the previous day’s high, low, and close prices to calculate eight levels of support and resistance.
Traders use the Camarilla Pivot Points Indicator to help them make trading decisions, particularly in intraday trading.
Download Free Camarilla Pivot Points Indicator
By identifying key levels of support and resistance, traders can determine where to enter or exit trades, set stop-loss orders, and take profit targets.
This indicator is popular among day traders due to its ability to provide real-time insights into market trends.
In this article, we will explore how the Camarilla Pivot Points Indicator works and how traders can use it effectively in their trading strategies.
What is the Camarilla Pivot Points Indicator?
The section currently under discussion pertains to an analytical tool used in financial markets for the purpose of identifying potential levels of support and resistance, based on a specific mathematical formula.
The Camarilla Pivot Points Indicator is widely used by traders as it provides them with easy-to-read information about market trends.
This indicator can be applied to any type of asset, including stocks, futures, currencies, and commodities.
The Camarilla pivot point calculation is different from other pivot point indicators because it takes into account the previous day’s open, high, low and close prices.
This makes it more dynamic than traditional pivot points that rely only on the closing price.
By using this formula, traders can identify key areas where prices may reverse or continue their trend.
Additionally, traders can use the Camarilla Pivot Points Indicator to determine stop-loss orders or profit targets when trading in volatile markets.
How Does the Camarilla Pivot Points Indicator Work?
An understanding of the operational mechanisms employed by the Camarilla Pivot Points Indicator can enhance trading decisions and potentially lead to increased profitability for investors.
The calculation process involves using a specific formula that takes into account the previous day’s high, low, and close prices to determine key levels of support and resistance for the current trading day.
These levels are then used as potential entry and exit points for traders. The Camarilla Pivot Points Indicator is widely used in different markets such as stocks, futures, forex, and commodities.
It can be applied to any time frame from intraday trading to longer-term investing strategies. Traders use this indicator in various ways such as identifying potential breakouts or reversals, determining stop-loss levels, and setting profit targets.
Overall, understanding how this indicator works can provide traders with an additional tool to help make informed decisions while minimizing risk.
How Can Traders Use the Camarilla Pivot Points Indicator?
Intraday trading strategies using the Camarilla Pivot Points Indicator involve identifying potential breakout or reversal levels based on the calculated support and resistance levels.
Traders can use these levels as potential entry and exit points for their trades, depending on market conditions and price movements.
However, it is important to note that the indicator has certain limitations, such as its sensitivity to sudden market movements and its failure to account for long-term trends.
Intraday trading strategies
Strategies for trading within a single day can benefit from the utilization of an analytical tool that provides clear indications of potential shifts in market direction.
The Camarilla Pivot Points Indicator is one such tool that traders can use to identify support and resistance levels, as well as potential breakout points.
Different intraday trading styles may utilize the indicator in varying ways, but most commonly it is used to determine entry and exit points for trades.
Intraday traders who focus on popular trading markets such as forex, stocks, and commodities can use the Camarilla Pivot Points Indicator in conjunction with other technical analysis tools to make informed decisions about when to enter or exit positions.
For example, some traders may look for a break above a resistance level indicated by the indicator as a signal to buy a currency pair or stock.
Others may wait for confirmation from additional indicators before making any moves.
Additionally, traders may adjust their approach depending on market conditions and volatility levels.
Overall, the Camarilla Pivot Points Indicator can be a valuable addition to an intraday trader’s toolbox when used thoughtfully and in combination with other analysis methods.
Potential entry and exit points for trades
By identifying potential entry and exit points for trades, traders can better position themselves to take advantage of market shifts and increase their chances of success.
One way to do this is through the use of technical analysis tools such as the camarilla pivot points indicator. This tool is designed to identify key price levels based on previous day’s high, low, and close prices.
These levels are then used as potential entry and exit points for trades. For example, if a stock’s price is trading above the camarilla resistance level, it may be a signal to enter a short position as the stock may be overbought.
On the other hand, if a stock’s price is trading below the camarilla support level, it may be a signal to enter a long position as the stock may be oversold. By using these levels in combination with other technical indicators and market analysis techniques, traders can increase their chances of making profitable trades in volatile markets.
Advantages and limitations of the tool
The analysis of the camarilla pivot points indicator’s pros and cons can help traders gain an in-depth understanding of its usefulness in identifying potential entry and exit points.
One advantage of this tool is that it uses numerous support and resistance levels, providing traders with a more comprehensive view of market trends. This enables them to make informed decisions when entering or exiting trades, as they have a better understanding of where the market may be heading.
On the other hand, one limitation of the camarilla pivot points indicator is that it does not work well in volatile markets. In such situations, prices often fluctuate unpredictably, making it difficult for indicators like this to provide accurate readings.
Additionally, while camarilla pivot points are useful for short-term trading strategies, they may not be effective over extended periods. Traders should also consider combining this tool with other technical analysis methods to improve their chances of success in real-life examples.
Conclusion
The Camarilla Pivot Points Indicator is a technical analysis tool used by traders to identify potential support and resistance levels in the market.
It uses a complex mathematical formula to calculate eight different levels, including four support levels, four resistance levels, and a central pivot point.
This tool is commonly used by day traders who are looking for short-term trading opportunities.
Traders can use the Camarilla Pivot Points Indicator to help them make more informed trading decisions.
By identifying key support and resistance levels, they can determine when to enter or exit trades.
Traders may also use this indicator in conjunction with other technical analysis tools to confirm their trading signals.
While this indicator does not guarantee success in the market, it can provide valuable insights that traders can use to improve their chances of making profitable trades.
