Introduction to the Auto Trendline Indicator
The Auto Trendline Indicator is a technical analysis tool that automatically draws trendlines on a price chart. It identifies significant swing highs and lows and connects them to plot the overall market trend. This saves traders the time and subjectivity involved with manually drawing trendlines.
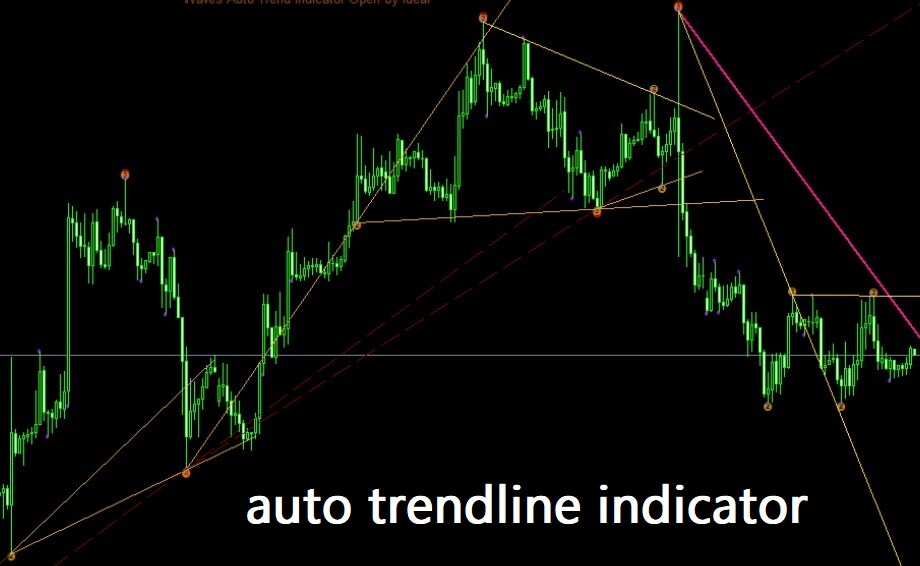
Download Free Auto Trendline Indicator
Trendlines are one of the most basic yet powerful concepts in technical analysis. They connect two or more price pivot points and help determine:
- The prevailing trend direction
- Potential areas of support and resistance
- When a trend reversal or breakout may occur
Manually plotting accurate trendlines can be tedious and prone to bias. The Auto Trendline Indicator for MT4 eliminates this frustration by automatically plotting only the most relevant trendlines on the chart.
This article provides an in-depth educational review of the Auto Trendline Indicator. It covers how the indicator works, its key features and settings, pros and cons, and tips for effectively trading with this tool.
How the Auto Trendline Indicator Works
The Auto Trendline Indicator uses an algorithm to identify swing highs and lows on the chart. It then connects these pivot points to plot uptrend and downtrend lines automatically.
The indicator continually tracks price action and adjusts or removes trendlines that are no longer relevant. This ensures only the most valid trendlines stay plotted on the chart over time.
The main steps involved in the Auto Trendline Indicator algorithm are:
- Identify swing highs and lows – The indicator first scans the price data to detect significant pivot highs and lows. The sensitivity for detecting pivots can be adjusted in the indicator settings.
- Connect pivot points – The algorithm connects identified swing highs to plot uptrend lines and swing lows to plot downtrend lines. Trendlines extend into the future to show potential areas of support and resistance.
- Validate relevance – The indicator assesses the strength and validity of each trendline over time. Trendlines that are no longer relevant due to a trend reversal or breakout are removed from the chart.
- Adjust angle – The indicator continually tracks price action and adjusts the angle of trendlines in response to new swing pivots forming. This ensures accuracy as the trend evolves.
The end result is the Auto Trendline Indicator plotting only the most accurate and up-to-date trendlines on the chart automatically. No more guessing or manually adjusting!
Key Features and Settings
The Auto Trendline Indicator has several customizable settings traders can tweak to control the sensitivity and appearance of the plotted trendlines:
Swing High/Low Strength – Adjusts the relative strength required for a pivot high or low to qualify for plotting a trendline. Lower values will detect smaller swings while higher values focus on more significant pivots only.
Bars Back – Determines how far back the indicator scans for potential swing pivots to connect. Lower values focus on recent price action while higher values plot trendlines encompassing more historical data.
Line Style – Choose the visual style, width, and colors for uptrend and downtrend lines independently. For example, make uptrends solid blue lines and downtrends dashed red lines.
Alerts – Enable price crossover and touch alerts on the auto-plotted trendlines. Alerts trigger when price interacts with trendlines in real-time.
These settings allow fine-tuning the indicator’s sensitivity to best match different trading plans, time frames, and market conditions.

Check our advanced Forex Master Levels Indicator
Pros and Cons of Using the Auto Trendline Indicator
Here are some key advantages and potential disadvantages when using the Auto Trendline Indicator:
Pros
- Eliminates manual trendline drawing time and subjective bias
- Continually adjusts to plot only the most valid trendlines
- Easy to interpret overall market trend at a glance
- Customizable settings to fit different trading styles
- Can enable alerts for trendline price interactions
Cons
- Too many trendlines plotted can cause chart clutter
- May lag or not adjust quickly enough to volatile markets
- Could encourage over-reliance on indicator rather than price action
- Requires combining with other analysis for trade signals
Overall, the Auto Trendline Indicator can save time and provide an objective overview of the market structure. But like all indicators, it should complement rather than replace price action analysis.
Tips for Trading with the Auto Trendline Indicator
Here are some tips for effectively using the Auto Trendline Indicator in your trading:
- Use on higher time frames (4H, daily, weekly) for identifying primary trends
- Focus on trendlines with 3 or more pivot touch points for validity
- Look for clusters of separate trendlines showing strong support/resistance zones
- Combine with candlestick patterns, momentum oscillators, volume for confirmation
- Plot separate manual trendlines on lower time frames to catch breaks early
The Auto Trendline Indicator excels at objectively highlighting the prevailing trend on higher time frames. You can then drill down to lower time frames for plotting manual lines to anticipate potential breakouts.
Always wait for confirmation signals before entering new trades based solely on the indicator’s trendlines. Examples include price/indicator divergences, candlestick patterns, or momentum shifts.
Conclusion
The Auto Trendline Indicator eliminates the frustration of manually identifying and plotting trendlines on price charts. It detects swing highs and lows then connects them to draw uptrend and downtrend lines automatically.
The indicator stays reactive to price action, adjusting and removing outdated trendlines over time. This provides an objective and accurate overview of the market’s structure.
Traders can enable alerts on the auto-plotted trendlines to monitor price interactions in real-time. But the indicator should not replace analyzing the raw price action.
By automating the trend identification process, the Auto Trendline Indicator allows focusing more time on executing trades aligned with the major trends. Use it in conjunction with other analysis methods for making high-probability trading decisions.