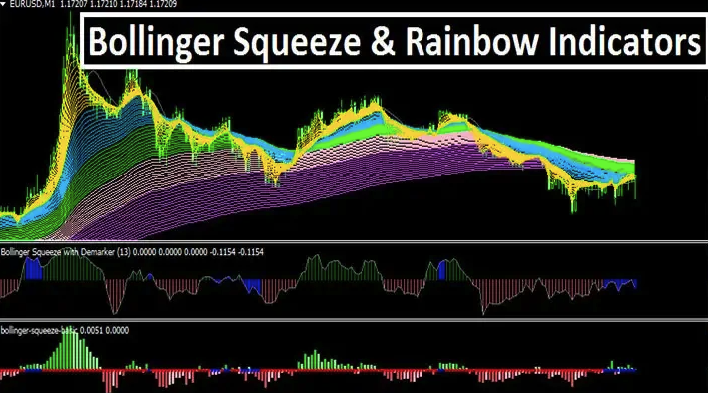
Bollinger Squeeze & Rainbow Indicator For Mt4 Review
Technical analysis is an essential tool for traders in the financial markets. It helps them to identify trends and patterns that can be used to make informed trading decisions.
One of the most popular technical indicators used by traders is the Bollinger Squeeze Indicator, which is a volatility indicator that measures the range between two standard deviations from a moving average.
Download Free Bollinger Squeeze & Rainbow Indicator For Mt4
Another commonly used indicator is the Rainbow Indicator, which uses multiple moving averages to identify trend direction and strength.
The Bollinger Squeeze and Rainbow Indicator are both powerful tools for identifying trading opportunities in different market conditions. When combined, they provide even more valuable insights into market trends and price movements.
In this article, we will explore how these two indicators work, how they can be combined, and some tips for using them effectively in your trading strategies.
Understanding the Bollinger Squeeze Indicator
The section focuses on comprehending the technical analysis tool that identifies periods of low volatility and potential breakouts in financial markets, through the use of a band of moving averages around price data.
The Bollinger Squeeze Indicator is a popular trading tool used by investors to generate trading signals based on market volatility. It was developed by John Bollinger in the 1980s and is widely used today due to its simplicity and effectiveness.
The Bollinger Squeeze Indicator uses two bands that are plotted above and below a moving average line, which represents the average price over a certain period. These bands are calculated using standard deviation, which indicates how much prices have deviated from their average value.
When the distance between these bands narrows down significantly, it signifies low volatility or consolidation in the market. This condition is called a ‘squeeze,’ indicating that traders should be prepared for an upcoming breakout or significant price movement.
The indicator generates buy or sell signals when prices break out of this consolidation phase, providing an opportunity for traders to capitalize on market trends and make profits.
Understanding the Rainbow Indicator
A thorough comprehension of the Rainbow Indicator, also known as the Rainbow Moving Average (RMA) Indicator, can assist traders in making informed decisions and potentially reduce emotional trading.
The RMA indicator is a technical analysis tool that utilizes a complex color scheme to represent different moving averages. The colors range from red to violet depending on the level of average price movement. Red signifies lower levels of average price movement while violet represents higher levels.
The RMA indicator can also be used in conjunction with the Bollinger Squeeze Indicator when interpreting signals. When the Bollinger Bands contract, indicating low volatility, this may signal an upcoming breakout or trend reversal.
Traders can use the Rainbow Indicator to identify whether prices are trending up or down based on their position relative to each other and make informed trades accordingly. In sum, understanding how to interpret both indicators can allow for more accurate decision-making in trading strategies and help traders avoid impulsive reactions due to emotions such as fear or greed.
Combining the Two Indicators
Combining the Bollinger Squeeze and Rainbow Indicator for MT4 can lead to improved trading strategies. By using these two indicators together, traders can identify potential trades with greater accuracy and precision.
Successful trades have been made using both indicators in a variety of market conditions, highlighting their effectiveness when used in conjunction with each other.
How to Use Them Together to Improve Your Trading Strategy
By integrating the Bollinger Squeeze and Rainbow indicators, traders can potentially enhance their trading strategy by identifying trends and potential breakouts in market volatility.
The Bollinger Squeeze is a technical analysis tool that measures the volatility of an asset’s price by comparing its current value to its historical standard deviation. When the price of an asset moves outside of its Bollinger Bands, this indicates a potential breakout or reversal event.
The Rainbow indicator, on the other hand, is a custom oscillator that combines multiple moving averages into one viewable chart. Traders use it to identify trends and momentum shifts over different timeframes.
To use these two indicators together effectively, traders should first select an appropriate timeframe for their trades based on their risk management strategy. Short-term traders may prefer using a smaller timeframe, such as minutes or hours, while long-term investors may opt for daily or weekly charts.
Once they have selected their timeframe, traders can then overlay both indicators onto their chart to identify potential trade opportunities. For example, if the Rainbow indicator shows a strong uptrend and the Bollinger Squeeze indicates that price volatility has been low for some time, this could suggest that a breakout is imminent.
By carefully managing their risk with stop-loss orders and position sizing strategies, traders can potentially profit from these types of events while minimizing potential losses in case of unexpected market movements.
Examples of Successful Trades Using Both Indicators
Traders can gain insight into successful trading strategies by examining examples of how the combination of technical analysis tools can be leveraged to identify trends, momentum shifts, and potential breakout or reversal events in different timeframes.
When using the Bollinger Squeeze and Rainbow Indicator together, traders need to understand the trading psychology behind successful trades. One common mistake when using these indicators is over-reliance on them to make decisions. It is important to use other forms of analysis such as fundamental data and market news to ensure a well-rounded decision-making process.
Another mistake traders make is not understanding the indicators’ limitations. The Bollinger Squeeze may suggest that a breakout is imminent, but it does not guarantee it. Similarly, the Rainbow Indicator may show strong trend signals, but it does not account for sudden market changes or unexpected news events that could shift momentum in another direction.
Successful traders combine technical analysis with market knowledge and intuition to make informed decisions based on multiple factors rather than relying solely on one indicator or tool.
Tips for Using the Bollinger Squeeze and Rainbow Indicator
Setting up and adjusting the Bollinger Squeeze and Rainbow Indicator in MT4 can be relatively simple, but it is important to ensure that the settings are calibrated to your specific trading preferences.
When incorporating these indicators into your trading plan, there are several best practices to consider. These include using multiple timeframes for confirmation, setting appropriate stop loss and take profit levels, and avoiding overtrading based solely on indicator signals.
Setting Up and Adjusting the Indicators in MT4
The process of configuring and customizing the technical tools within the trading platform is an essential step for traders seeking to use them effectively.
In MT4, setting up the Bollinger Squeeze and Rainbow Indicators involves adjusting their parameters to suit individual trading strategies. To customize the Bollinger Squeeze Indicator, traders can adjust parameters such as period, deviation, and shift. By doing so, they can modify the sensitivity of the indicator to market volatility and optimize its performance.
Interpreting indicator signals correctly is crucial to making informed trading decisions. When using the Rainbow Indicator in MT4, traders need to pay attention to its color changes as they signify different market conditions. The colors on this indicator represent a range of moving averages at various time periods; therefore, it helps traders identify potential trends or reversals in price action quickly.
Additionally, traders should also carefully observe how prices move relative to Bollinger Bands when using the Bollinger Squeeze Indicator. A tightening of these bands suggests a potential breakout in either direction while a widening indicates increased volatility levels.
Overall, by appropriately setting up and interpreting these indicators’ signals in MT4, traders can enhance their chances of successful trades while minimizing risks associated with their positions’ entry and exit points.
Best Practices for Incorporating Them Into Your Trading Plan
Incorporating technical analysis tools into a trading plan requires adherence to best practices that help traders effectively interpret signals and make informed decisions based on market conditions. When using the Bollinger Squeeze and Rainbow Indicator for MT4, it is essential to focus on risk management strategies and backtesting techniques. Risk management involves setting stop-loss orders, diversifying portfolios, and avoiding over-leveraging positions.
Backtesting strategies involve testing the indicators against historical data to identify patterns and trends that could predict future market movements accurately. This helps traders understand how well the indicators perform in different market conditions and avoid making impulsive decisions based on emotions or speculation. Additionally, incorporating other technical analysis tools such as trend lines, support/resistance levels, and price action can provide further confirmation of potential trade setups. Overall, incorporating these best practices when using the Bollinger Squeeze and Rainbow Indicator for MT4 can help traders improve their chances of success in forex trading while reducing risks associated with trading in volatile markets.
| Pros | Cons |
|---|---|
| Accurately identifies potential trades | False Signals |
| Easy to read visual aids | Lagging indicator |
| Suitable for both short-term & long-term traders | Less effective in sideways markets |
Conclusion
In conclusion, the Bollinger Squeeze and Rainbow Indicators are powerful tools for traders seeking to identify potential breakouts in the market.
The Bollinger Squeeze Indicator helps traders to spot low volatility periods which often precede high volatility trends while the Rainbow Indicator displays multiple moving averages on one chart, indicating a possible trend reversal.
When used together, these indicators can provide valuable insights into the market and help traders make better-informed trading decisions.
It is important to note that no indicator or combination of indicators can guarantee profits, but by understanding how these tools work and incorporating them into a well-planned trading strategy, traders can increase their chances of success.
As with any trading strategy, it’s essential to practice risk management and have a plan in place for managing losses.
